We are excited to announce new HR metrics powered by Machine Learning — a feature that will make your decision-making process even more data-driven.
Turnover, engagement, and burnout — by now everyone should know how to measure them, but can we predict them? Now, we are taking the first steps to make this a reality.
In this post we are going to cover three questions:
- What groups are at risk of leaving?
- What attributes increase or decrease engagement?
- What attributes increase or decrease burnout risk?
Let’s dive in.
Predicting Turnover
Employee turnover is of the utmost importance in every HR team. It creates additional foreseen and unforeseen costs, affects overall productivity, and leads organizations to lose the experience that makes them unable to ensure knowledge continuity.
To tackle this problem, turnover risk management strategies should include a process of identifying which employees are at risk of leaving after a specific time spent in a workplace.
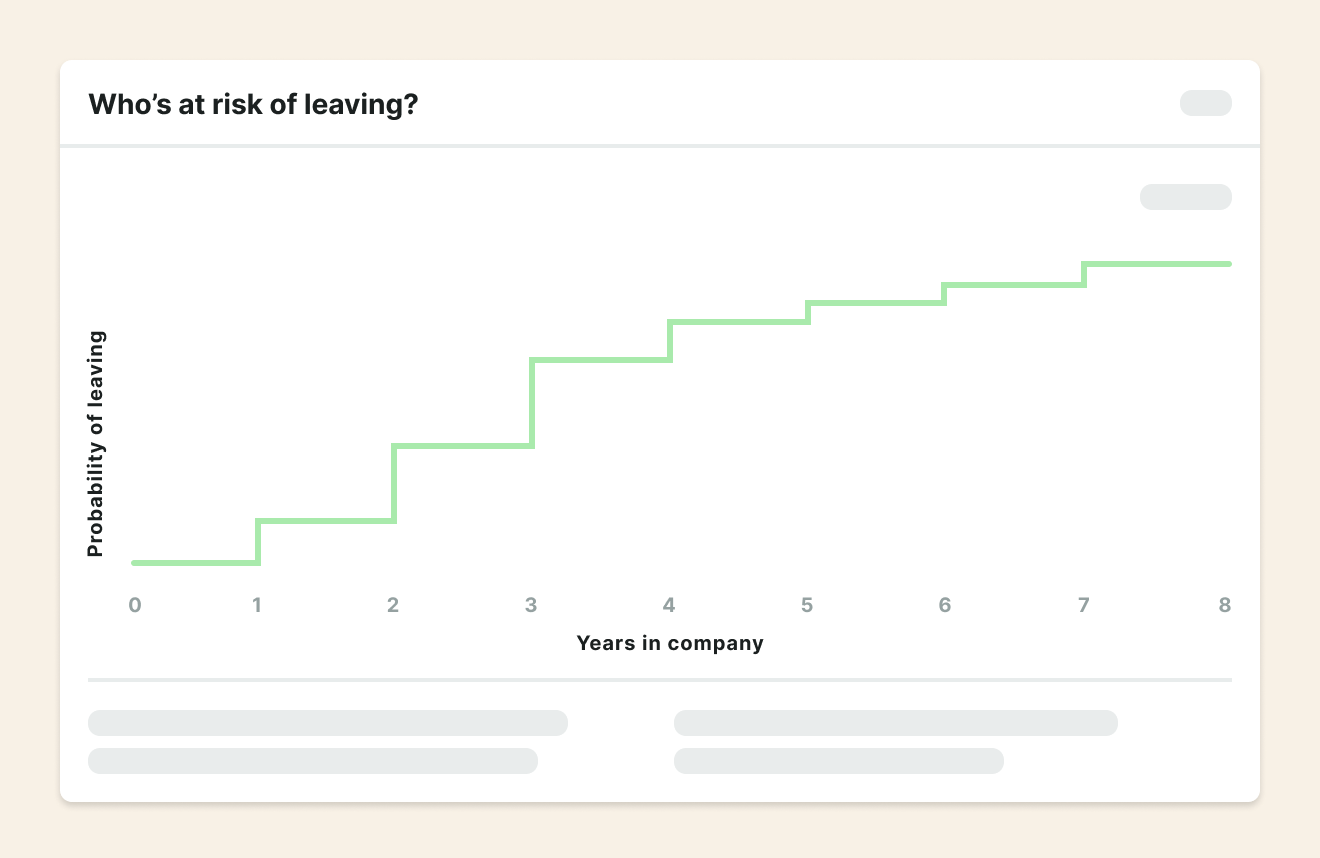
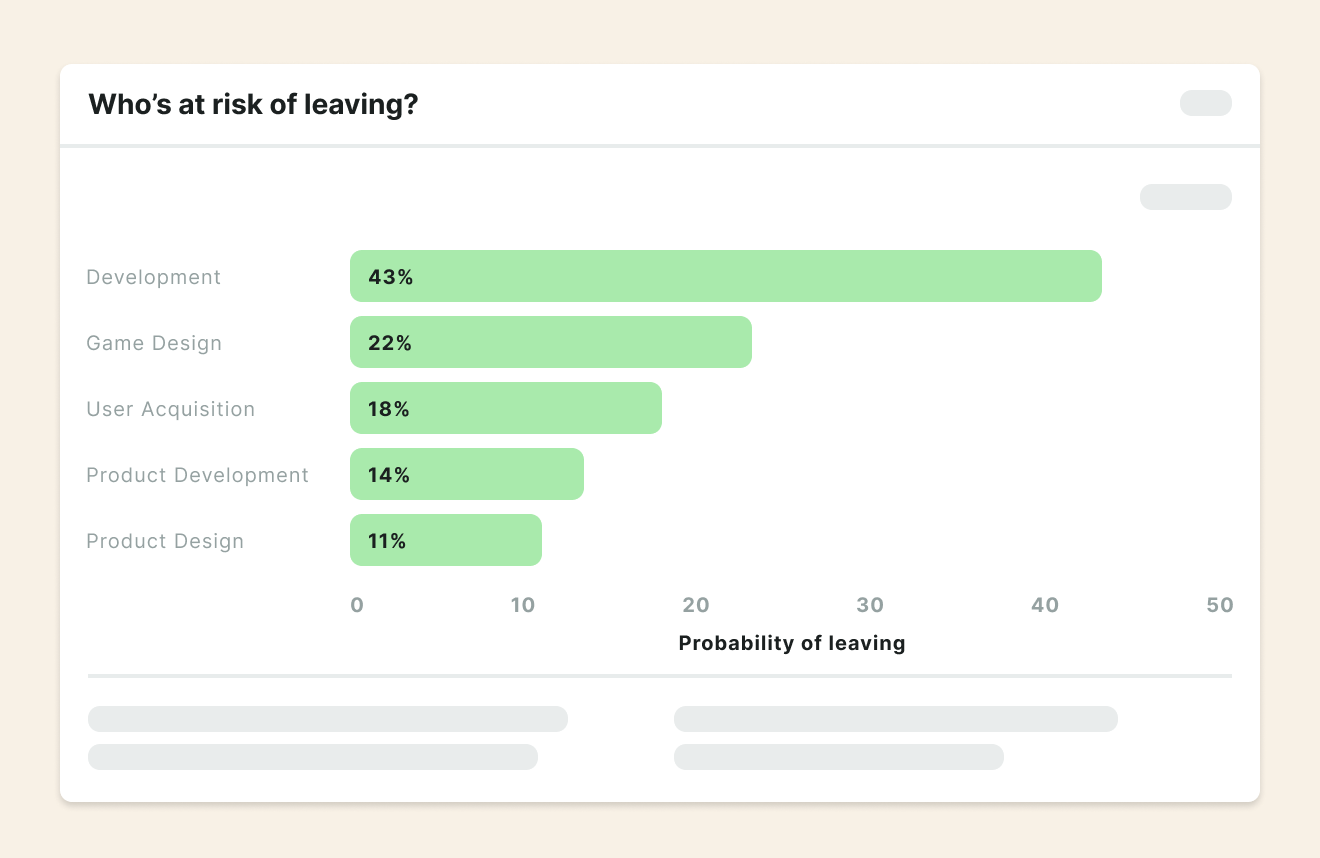
Our new metric “Who’s at risk of leaving?” is a nuanced, data-driven approach to solving this problem. More specifically, it identifies groups of employees who are at high risk of leaving the company.
Find “Who’s at risk of leaving?” metric in the Turnover chapter of our Story page.

This chart offers you a quick glance into employee turnover with respect to their tenure by providing information on the probability a random employee will leave the company after a specific period of time.
You can also get information on specific employee groups by applying the filter via a drop-down menu!

Once you have selected a filter of your choice, you will get information on which groups are at high risk of leaving the company within one year. This gives you insights into which groups to further investigate or target with your turnover risk management strategies!
If you are interested in investigating one specific group, a simple click on their bar will yield even more details.
What’s under the hood?
This feature combines two components: your data and statistical methods.
Your data
In order to get reliable insights, this method relies on your previous data on employees who left the company and those who didn’t. More specifically, it ties together information on how long an employee stayed in a workplace, their age, gender, department, team, performance category, grade, and quality of hire score.
Using this data, our approach provides you with completely user-specific predictions based entirely on your company’s history.
Statistical method
Extracting insights from data is the most important part of creating a data-driven story. For that purpose, we have used one of the most popular statistical approaches — survival analysis. It deals with the duration of time until an event of interest (e.g. employee leaving the company) occurs. This makes it one of the most suitable approaches to solving the problem of high turnover rates.
Our new feature not only gives a nice visual representation of your data on turnover, it will also help you manage and direct your turnover risk management strategies more properly.
Next time you discuss turnover and potential solutions, you’ll have a clear understanding of what is actually happening, what to expect, and where to channel your efforts.
Note our following next two metrics come as a result of our Employee Wellbeing Survey.
Predicting Engagement and Burnout
Engagement is emotional involvement in work that can be triggered by different organizational factors. When employees are engaged, they have more energy for their work and are more committed to the organization. This means highly engaged employees are more likely to stay at the company and to put in extra effort to reach their goals.
Having a widespread disengagement problem is expensive. If you don’t get engagement right, employees can be cynical, transactional, and have higher turnover than they would otherwise.
With such high replacement costs, finding and onboarding new employees adds up and hurts productivity.
We define Engagement as employees’ expression of Energy, Commitment to work, and Focus in their everyday job.
With the help of machine learning, we can find the most important drivers of engagement. This helps us focus on the areas that matter most, so that the changes we make actually improve employees’ effort, performance, and retention.
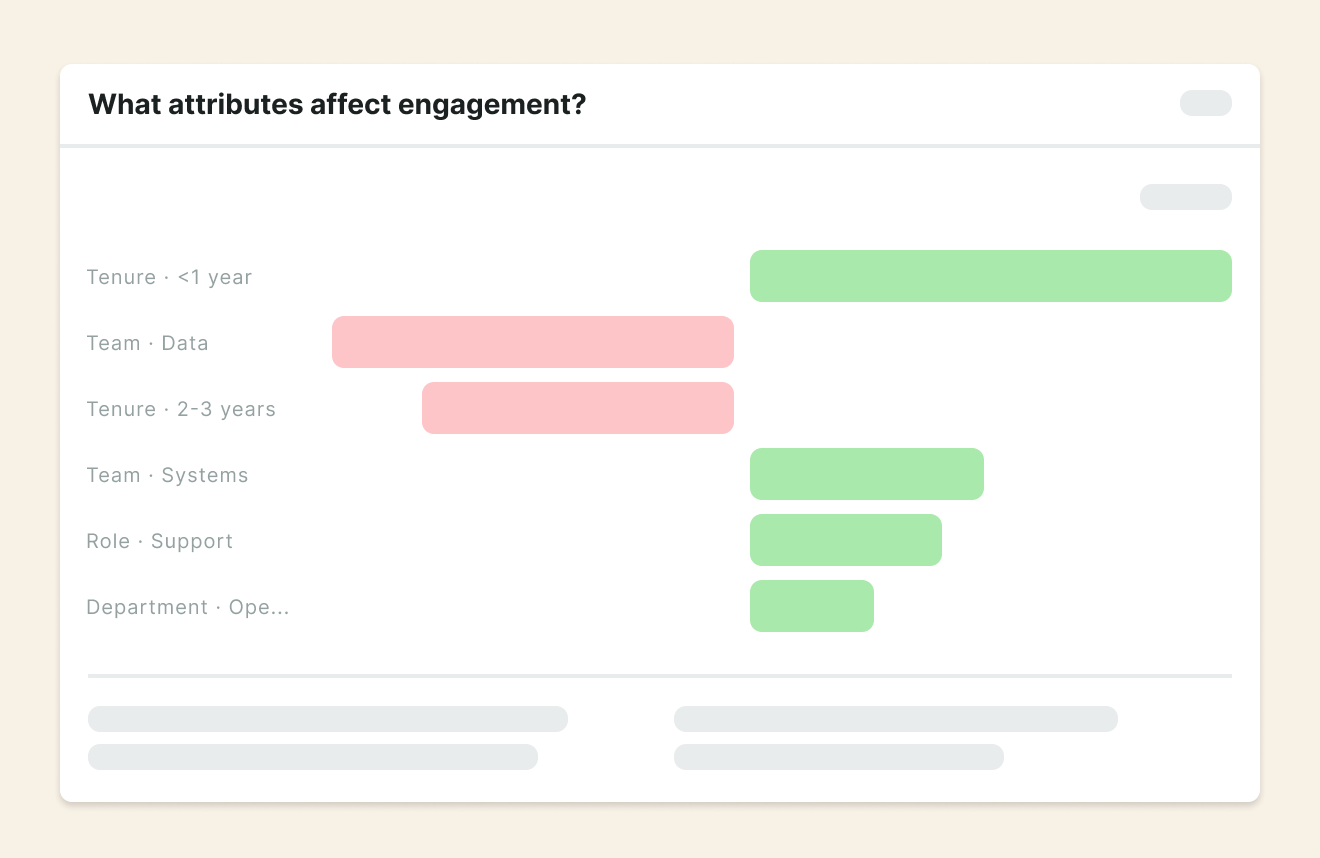
Find the “What attributes affect engagement?” question in the Employee Wellbeing chapter of our Story page.

This chart consists of two main components — the butterfly chart itself and the model accuracy. Let’s break it down.
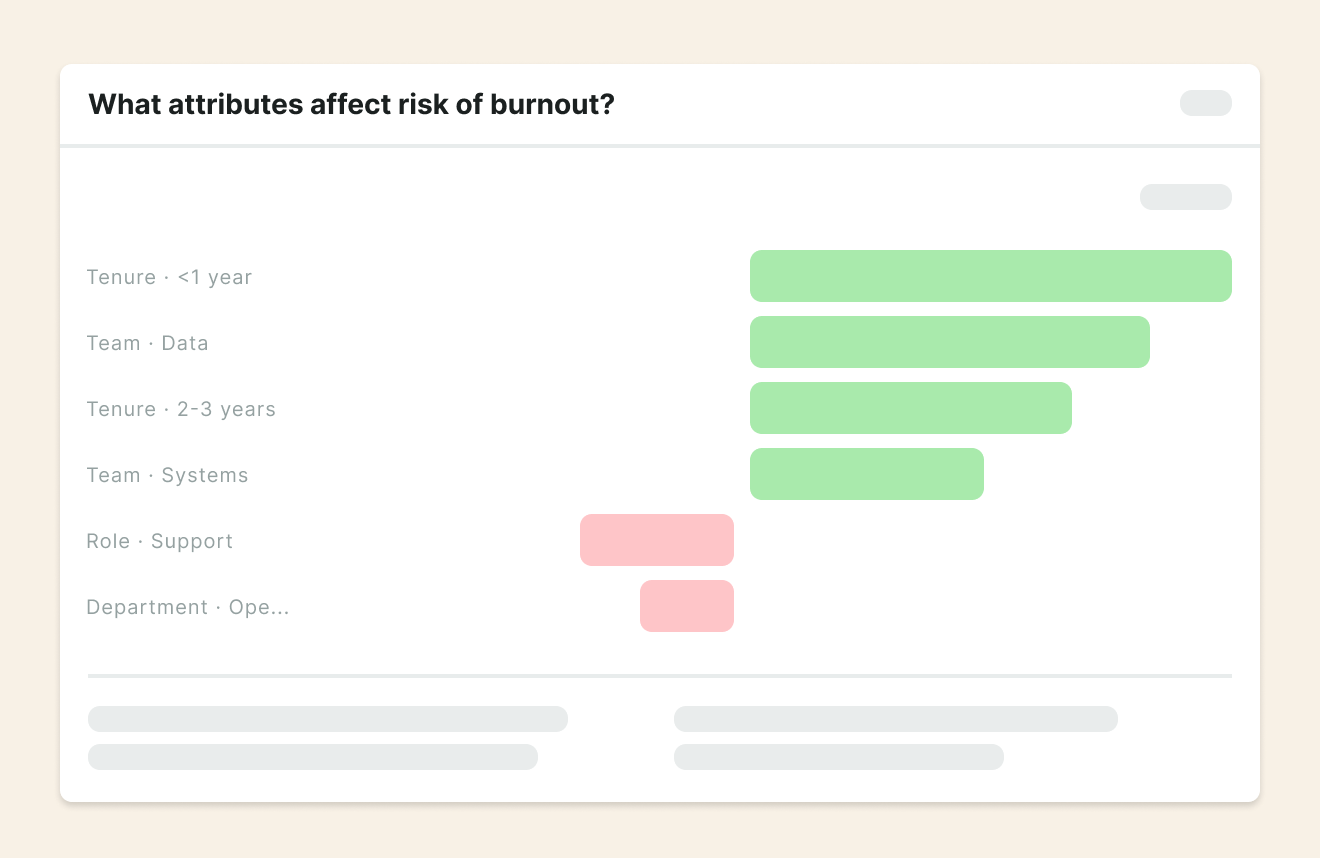
Each employee’s characteristics are shown on the left side of the chart and they can have either a positive or negative impact on engagement/burnout. Those characteristics include tenure group, age group, role, team, and department.
Positive impact, indicated with green bars, means that a specific characteristic is tied to higher engagement/lower burnout. The values can range from 0 to 100 – the greater the number, the greater the impact!
The negative impact, on the other hand, is indicated with red bars and means that a specific characteristic is tied to lower engagement/higher burnout. Values for negative impact range from 0 to -100 — the lower the number, the more severe the negative impact.
Since Machine Learning models are not perfect, it’s important to assess a model’s performance. But don’t worry, we’ve got you covered with a rather straightforward metric – model’s accuracy.
The model’s accuracy can range from 0% to 100% — the model’s performance is better if the accuracy is higher.
Don’t worry if the accuracy doesn’t reach that shiny 100% number — it’s rarely the case with real-world data!

Burnout is an occupational hazard for various knowledge workplace positions that can seriously harm employees’ mental health. This has huge implications for employees, their families, and their organizations.
We define burnout as a psychological syndrome that is often expressed by employee’s Emotional Fatigue, Pessimism, and lowered overall Efficacy at work. This exhaustion, cynicism, and low self-esteem make it difficult for employees to perform at work in a sustainable way.
Companies that don’t address employee burnout can end up with a high turnover, poorer performance, and negative word of mouth from current and former employees.
Find the “What attributes affect risk of burnout?” question in the Employee Wellbeing chapter of our Story page.
What’s under the hood?
In order to give you the information you can act on, our approach to predicting engagement and burnout relies on three components: your data, developing a Machine Learning model, and evaluating the model.
Let’s dive into each of the components.
Your data
If we want to make predictions and determine which aspects of employees’ experiences are important in relation to engagement or burnout, a Machine Learning algorithm must rely on your previous systems data. Your system’s data may include information on an employee’s age, salary, and tenure (among others), and our algorithm will delve even deeper by creating suitable combinations of that data. Therefore, you don’t need to worry whether the algorithm will find meaningful information — it is tailored based on your unique data!
Machine Learning model
In order to extract actionable insights, our approach relies on a Machine Learning algorithm which identifies rules and patterns in your previous data which can be used to infer how engaged or burned-out your employees are. Our approach also determines which aspects of employees’ experiences have positive or negative impact on engagement and burnout, which gives you a solid ground for drawing further conclusions!
Evaluating the model
Machine Learning models are great at spotting patterns in your data, but they are not error-free. We firmly believe that each user should be able to see how well a specific Machine Learning algorithm performs with regards to the amount and quality of provided data. We have boiled it down to one single number which is rather simple to interpret – the accuracy of the model.
Where are we heading?
This new feature greatly expands our previous Machine Learning efforts and gives you information you need in order to make data-driven decisions and communicate your results, strategies, and efforts more effectively with others. As you get cleaner data and our models become smarter by learning from it, we’ll get even more creative with introducing new metrics and supplementing existing ones.
More specifically, tackling the problem of burnout will be even easier once we arm you with more insights into the interplay of burnout and environmental support. Our efforts are also directed towards helping you detect unexpected information in your data and making your organizational structure even more comprehensible. All of this represents a stable ground for building a reliable and data-driven insight engine for CHRO, which will inform your decisions, actions, and reports.
If you have any questions or feedback, feel free to reach us at [email protected]
Until then, don’t be afraid to dive into your new metrics!
✳