Get more hires for your dollar with these metrics.
Which applicant sources are worth investing in? It’s hard to know at first glance. But the cost of sourcing should translate to success in hiring from those sources. If it doesn’t, divesting your time and energy from that source might be the best option.
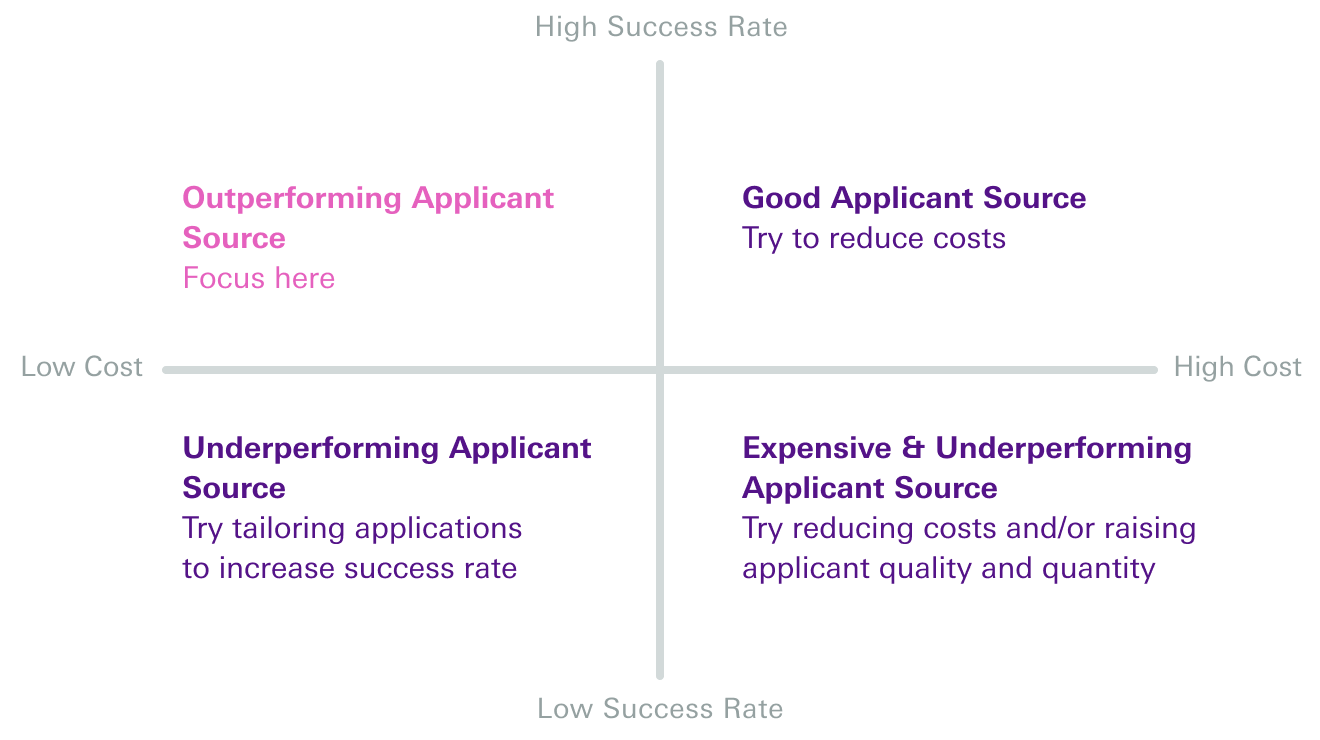
To find the most cost-effective hiring sources, first we need to know the cost of each hiring source. Then, we need the success rate of different applicant sources. The most cost-effective talent pools are those with the highest success rate and the lowest cost. You can categorize all your hiring sources into a simple matrix like the one below.
How do I calculate the cost-effectiveness of my sources?
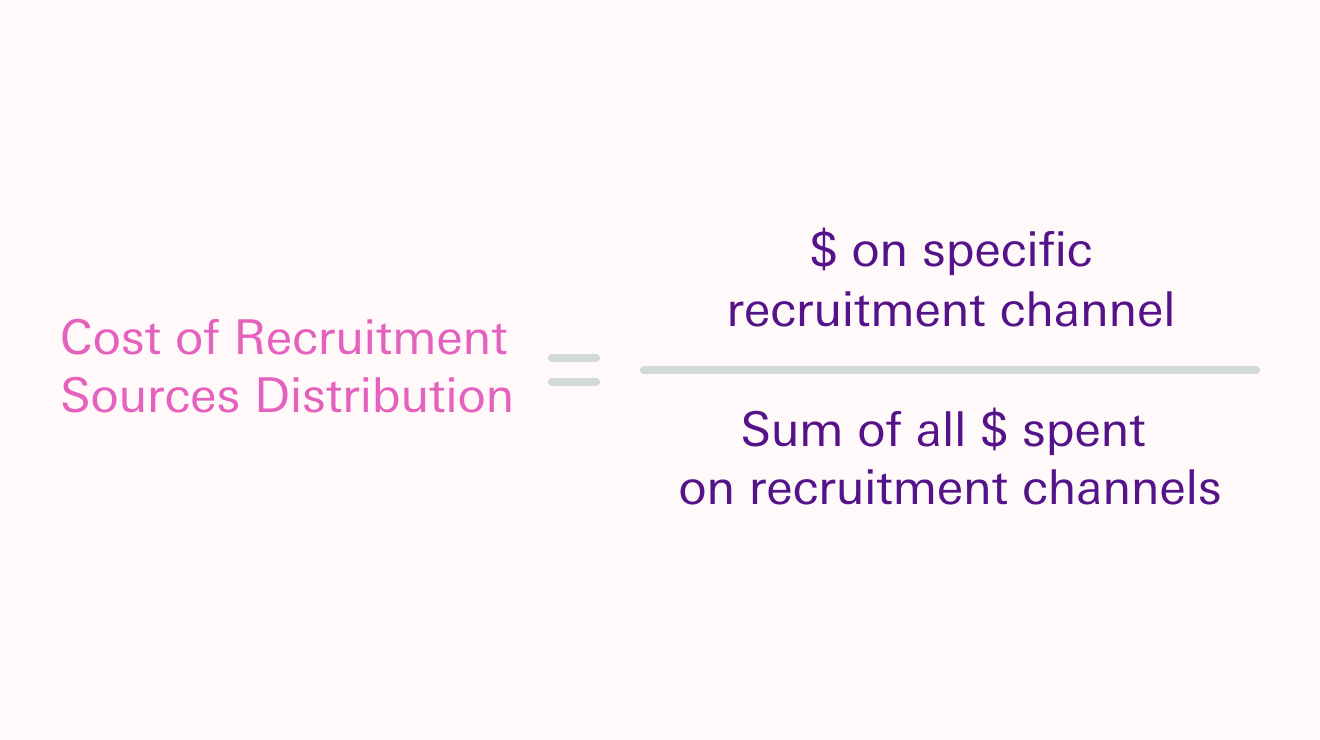
First, we need the cost of each recruitment source. This will tell us how much we are spending on each source to get applications, and is the first piece of the puzzle of where to invest our talent acquisition budget.
1/ Source Cost Breakdown
Next, we find the source success rate. This is the conversion rate per sourcing channel, and the second piece of the cost-effectiveness puzzle.
2/ Source Success Rate

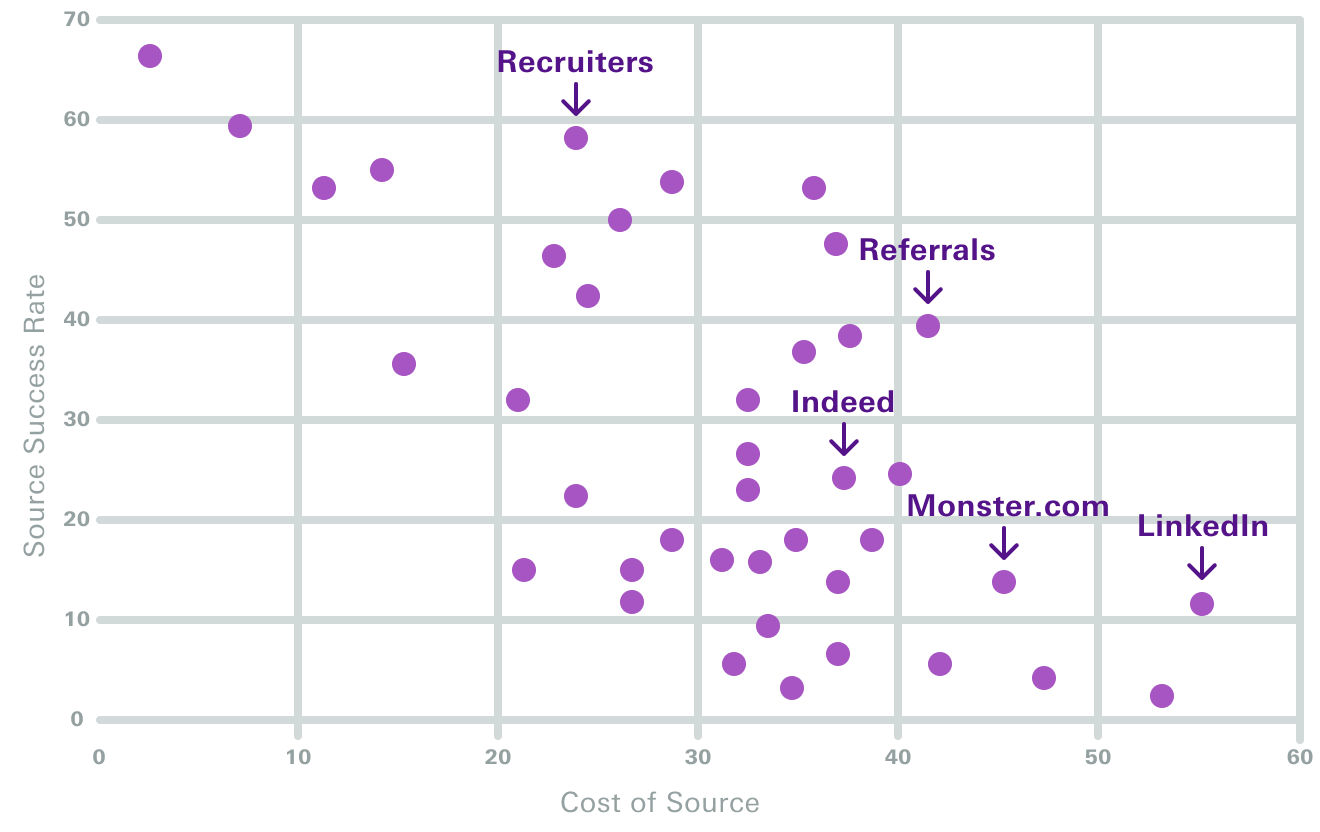
Finally, create a scatter plot with the cost of each recruitment source across the bottom (horizontal) line and the source success rate along the side (vertical) line. This scatter plot, which might look like the one below, aligns to the four categories of sources we explored at the top of the page. Layering that matrix on top of your scatter plot helps to decide what actions to take with each of your recruitment sources.
So What?
Success rates based on quantity might overlook some sources. To capture quality instead, consider simultaneously tracking quality of source metric that explores quality of hire scores across recruitment sources. With this approach, you can find the average quality of hire score across hires from the same source. Alternatively, you can find the spread (or variability) of quality within each recruitment source.
To gain a complete answer to the question you should also track the time component of hiring. Tracking a bundle of time-to-hire metrics and on-time hirings will help you see what sources result in the fastest hirings. This kind of information can help you assess hiring source effectiveness when the time is more critical than the overall cost.
Suggested scatter plots overlaid with various filters help you design a compelling story around your source effectiveness. Recruiters may be more expensive than a job board, but they may bring in better candidates, especially for senior-level roles. While LinkedIn may be popular in North America, other job platforms could be a better investment in different continents.
How do I answer this question with Orgnostic?
To find sourcing costs and use this Orgnostic feature, you’ll likely need to go beyond your ATS where we’ve found most of our other talent acquisition data. Other platforms, like enterprise resource planning systems or budgeting software, or simply spreadsheets, may house the cost data for each recruitment source. Ingesting and cleaning this data through specific integration or spreadsheet import is a way to map it onto our metamodel, along with an API connection with your ATS.
From here, you can use our pre-set filters to show how the cost-effectiveness of your sources change across job roles, hiring location, seniority, gender, but also compa-ratio and salary bands.
From the Talent Acquisition series: