Applicants per hire is a critical metric for talent acquisition professionals.
How many haystacks do you need to search through to find that one needle? Today we’ll talk about how to get an accurate applicants per hire metric, how to track it over time and across roles, and what you can do to find the right person more efficiently.
Imagine you post a new job on LinkedIn on Tuesday. Applications start rolling in, and you’re excited. So many people pressed “Quick Apply” on LinkedIn! By Friday, 120 people have applied. The next week, you review the applicants and find that only 40 are even remotely experienced in the field you want, and only 20 of them seem to meet your skills criteria. Compare that with a narrow, but targeted job search on a with 8 skilled applicants out of 10. The latter could end up saving a lot more time, despite having a much smaller applicant pool!
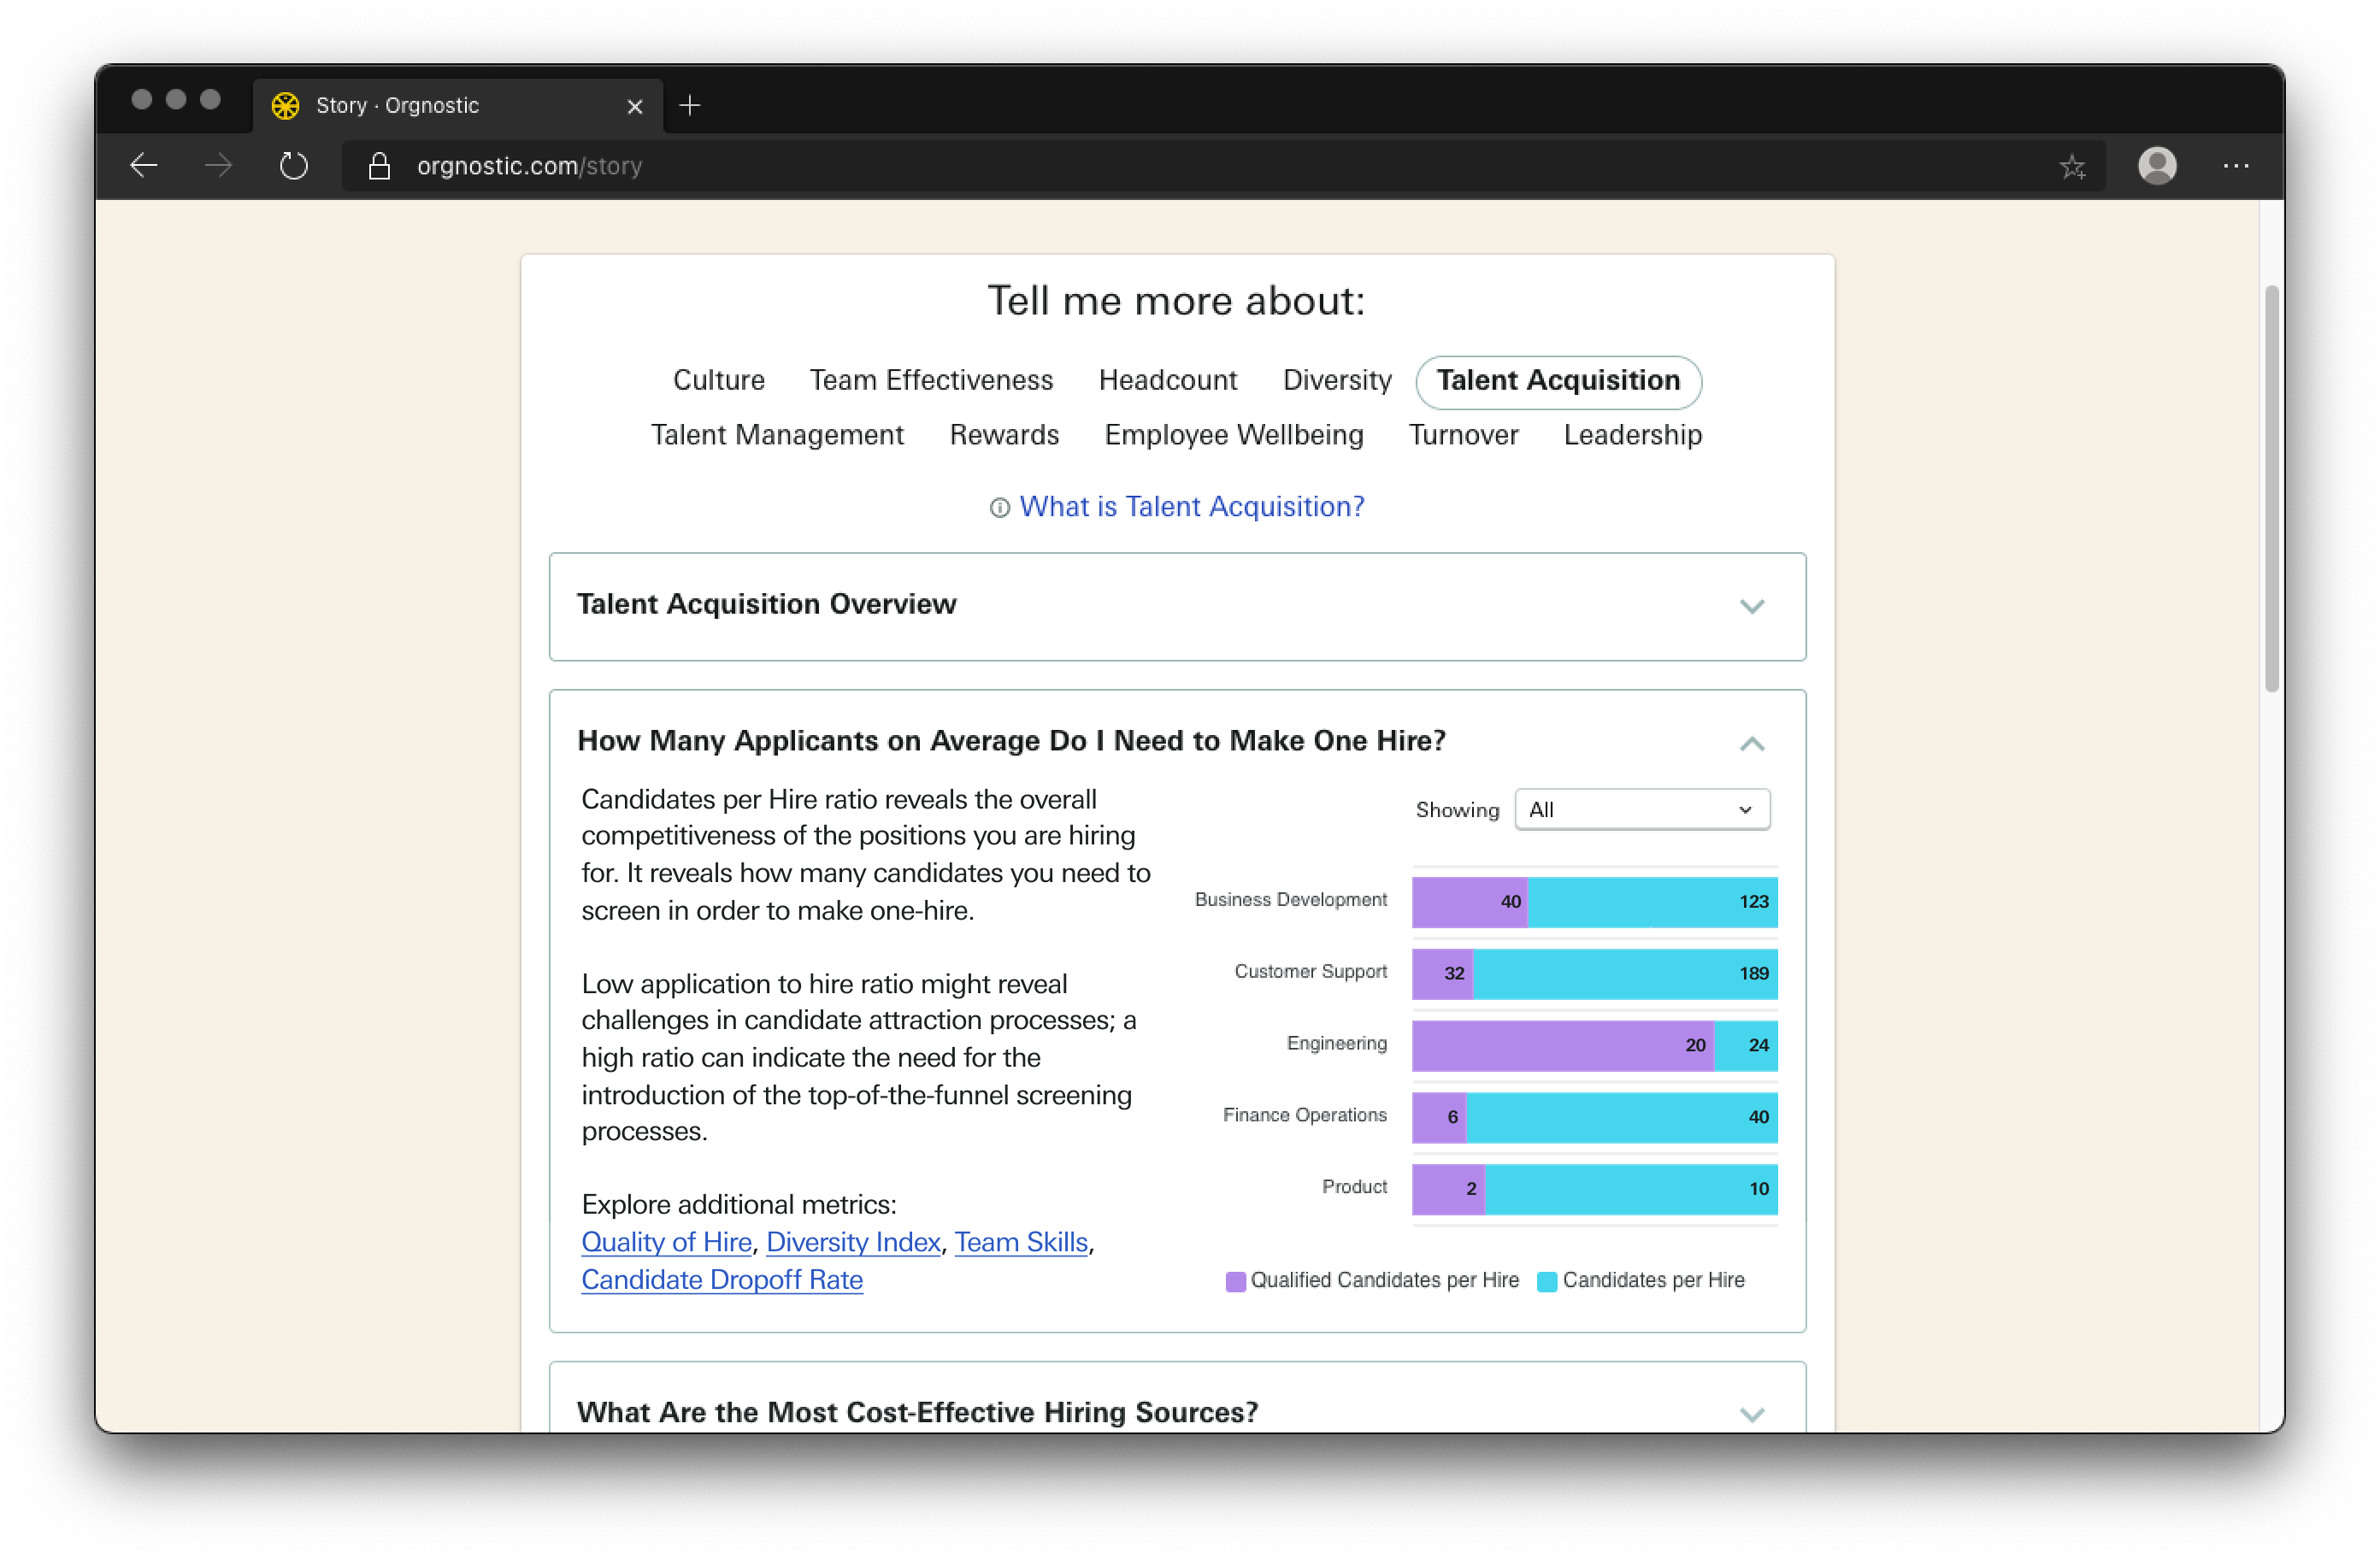
To determine how many applicants you need to make one hire, you should track two metrics: candidates per hire and qualified candidates per hire:
1/ Candidates per Hire
The number of candidates varies greatly depending on the company, location, role, and the type of work. Too many candidates takes too long to screen, yet having too few candidates risks suboptimal hires.
2/ Qualified Candidates per Hire
Qualified candidates means they passed the screening stage so they match the basic requirements of the role. If you have recruiters sourcing candidates, all of their applicants should be qualified at the start. Applicant tracking system (ATS) benchmarks tell us that most companies, depending on the industry and the role, have 20-30 qualified candidates for each hire.
So what?
These two metrics tell us exactly how many candidates we need to make one hire. But why and how are these stats important in your organization?
To make a compelling story around candidates per hire question, you would want to track a couple of other metrics too. For one, you want to know whether you have an issue with candidates dropping out of your process, at what stages of the selection process, and if that increases the number of candidates you need. If candidates drop out of the process before we finish, we might need more candidates to keep the same level of quality.
Dropoff or dropout rates can change based on candidates’ experiences at each stage. The factors affecting this include the length of the process; the fairness of your hiring stages; amount, timeliness, and quality of communication; giving clear explanations for the steps in your process; candidates’ feeling of fitting with the job and company; and whether candidates feel confident in their chances of getting the job. You can collect this information from your candidates by using a candidate experience survey.
A higher dropoff rate will raise the applicants per hire you need for a successful job search. But you can improve both metrics, once you start tracking them.
Finally, you want to know whether a lower number of candidates leads to a worse quality of hire, decreases team diversity, and the team’s perception of whether you have the right people in the team.
You shouldn’t be surprised to see differences in applicants per hire across business lines and positions. After all, a role with fewer educational and skills requirements will be open to more applicants, and you’ll find that more folks apply for that position. Dropoff rates shouldn’t differ as much, if you have strong and consistent hiring processes that are designed with the applicant’s experience in mind. If you’re unhappy with the numbers you’re seeing, start at the top of the funnel; consider swapping out years of experience requirements and instead, describe the exact skills you need and the type of achievements that role will work towards.
How do I answer this question with Orgnostic?
Orgnostic pulls the data from your ATS and HRIS system, and enriches it with automated micro surveys, called data-fillers. That helps you answer this question with a full array of metrics including: Candidates per hire, Qualified Candidates per Hire, Candidate Drop-off Rate, Quality of Hire, Diversity Index, Team Skills, to make a convincing narrative. With pre-set filters you can compare how these metrics change over time and compare them across departments, seniority levels, and more.
From the Talent Acquisition series: