We’re excited to roll out a feature that’s set to redefine how you interact with data on our platform. Welcome to Custom Boards – your new data playground!
Customizing the platform experience
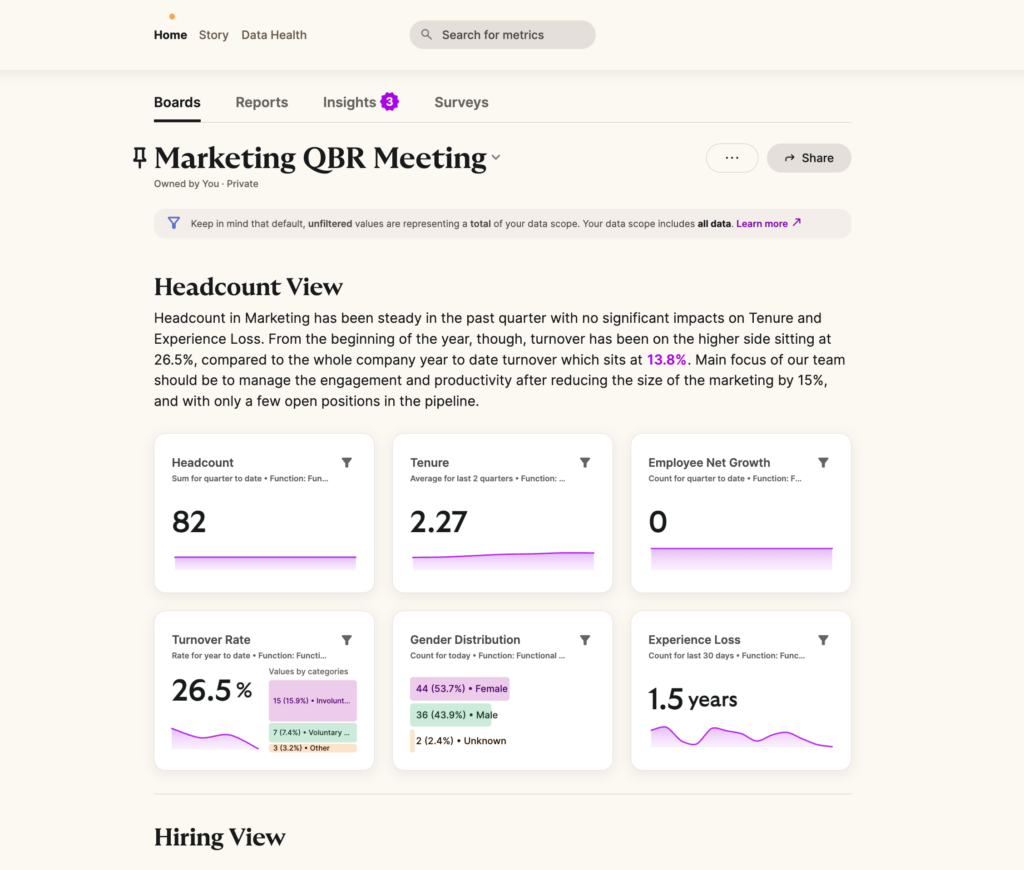
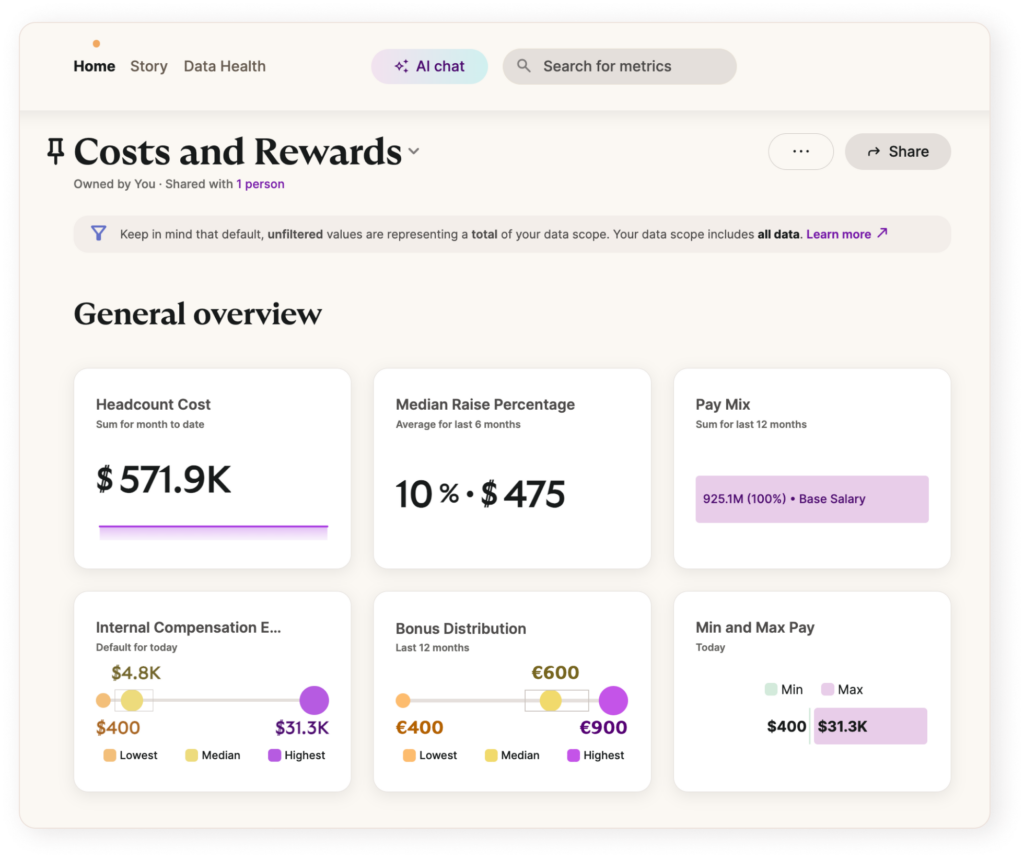
Ever thought your HR tools could be as flexible and insightful as your own team? Enter the game-changing Custom Boards! It’s not just about crafting a dashboard that mirrors your workflow; it’s about spinning up multiple views tailored to every stakeholder’s needs. Share these custom-crafted KPIs to empower decision-making, sparking conversations and driving strategies. Whether you’re an HRBP looking to drive a QBR conversation or a business leader seeking a snapshot of your team’s dynamics, these boards are your starting canvas for further exploration.
Dynamic text: embedding real-time data into your narrative
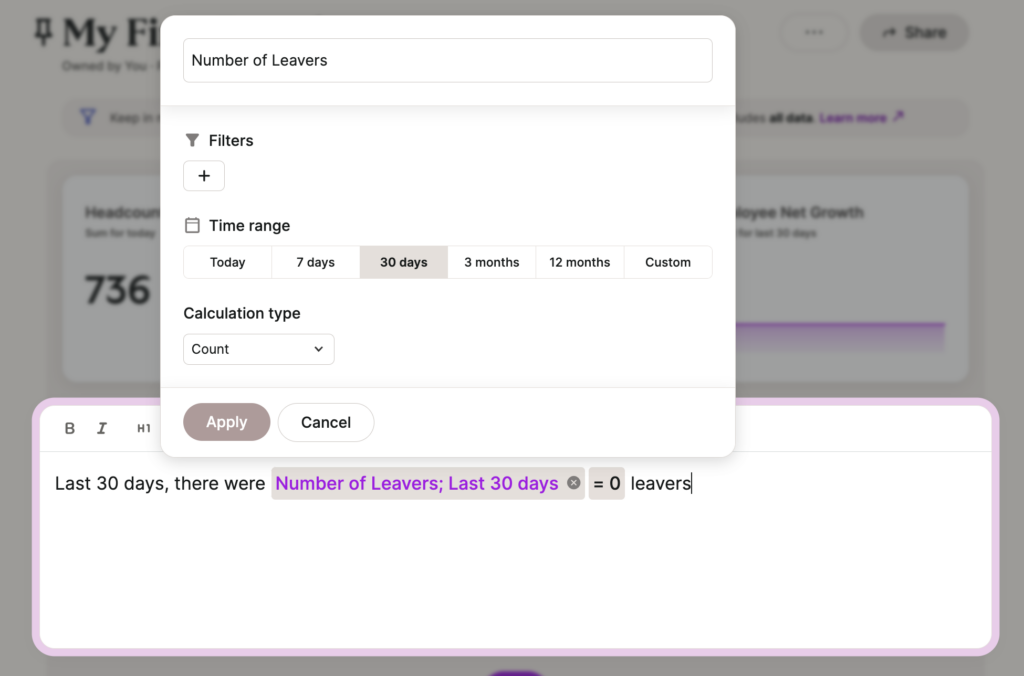
Crafting Custom Boards is effortlessly simple, enabling the selection of relevant metric cards, customization of titles, and the application of filters to suit your specific needs. At the heart of this customization is the dynamic text feature, a true highlight that seamlessly incorporates live, filterable metrics into your narratives, ensuring your data is always up-to-date and actionable. This intuitive functionality empowers you to create compelling, data-driven stories, bringing boards to life with real-time updates, ensuring data is current every time you view it.
Individual HR metrics boards for every stakeholder
HR teams often grapple with presenting complex data in a way that’s accessible and meaningful to various stakeholders within an organization. The challenge lies in selecting the right metrics to share, customizing the presentation for different audiences, and ensuring data privacy and relevance. This task can be overwhelming, particularly when dealing with diverse departments that value different KPIs. Our solution streamlines this process by allowing HR teams to create and share personalized dashboards. Each stakeholder receives tailored insights, fostering informed decision-making and strategic alignment across the board.
Detailed feature breakdown
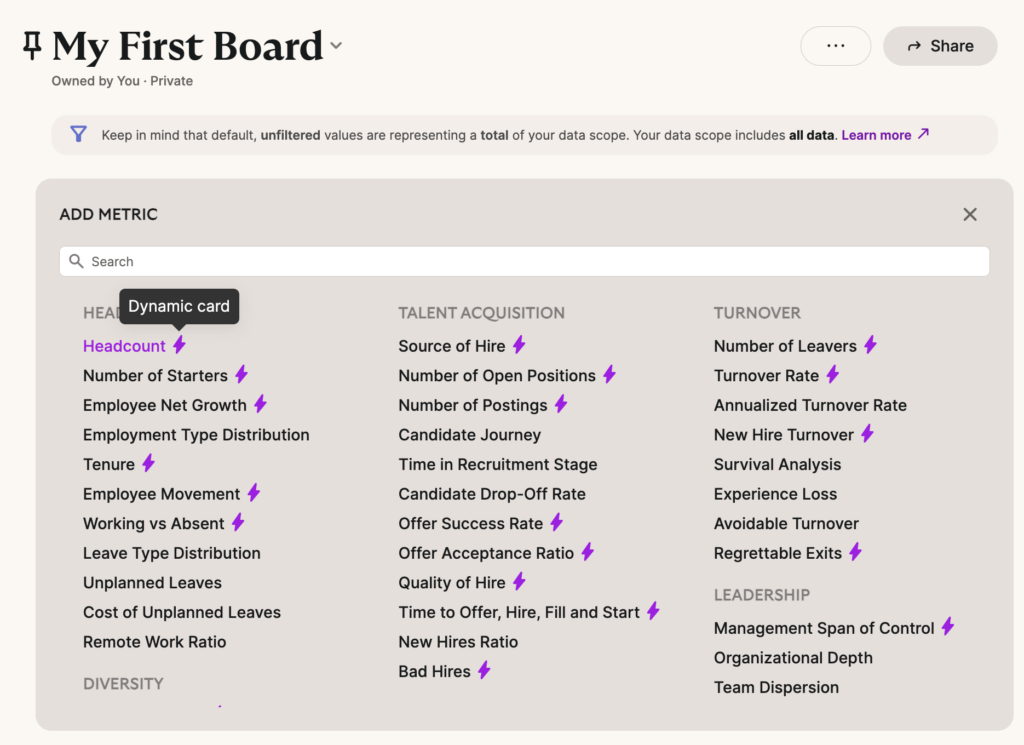
- Customizable Metric Cards: Choose from metrics like Headcount, New Starters, Number of Leavers, Number of Open Positions, Offer Success Rate, Turnover Rate and many more to create a dashboard that reflects your specific needs.
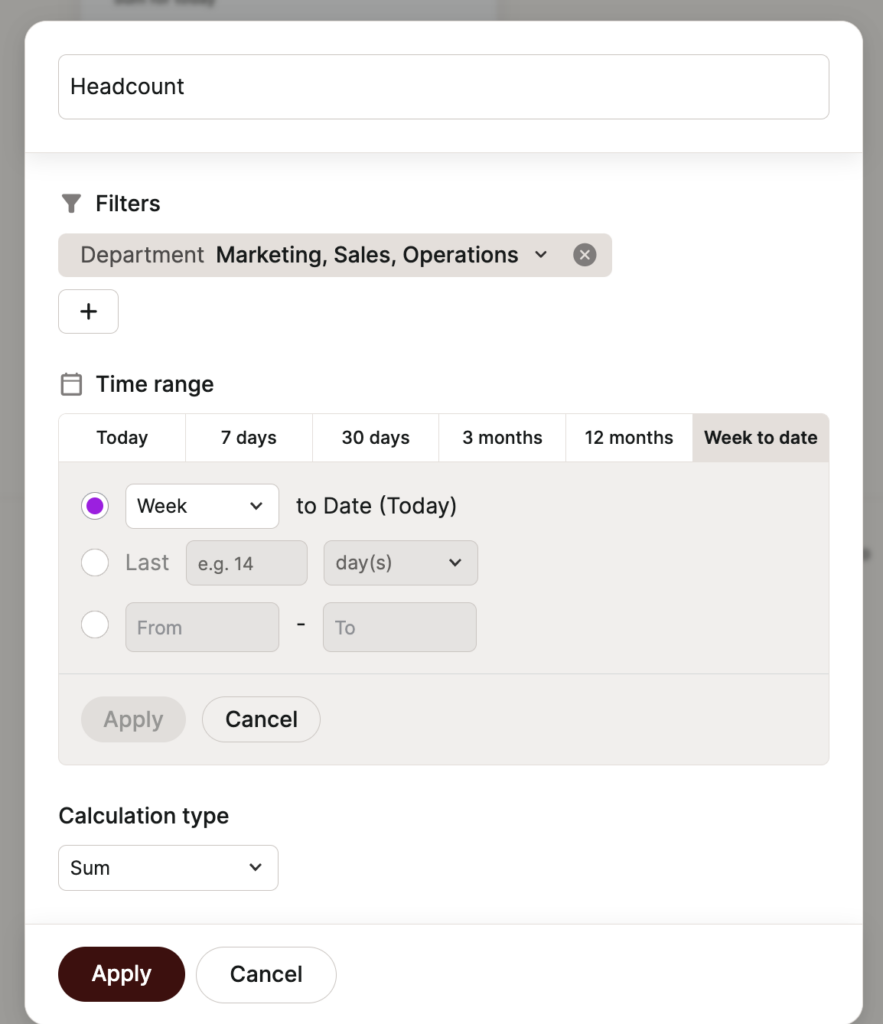
- Easy Filtering: Apply filters to each metric card to focus on particular employee groups or departments, tailoring the insights to your scope of responsibility.
- Time Range Customization: Adjust the time frame for data displayed on each card, from daily overviews to custom ranges, to ensure relevance of your current analysis.
- Card Renaming: Personalize the titles of your metric cards to align with your team’s terminology, enhancing clarity and relevance.
- Dynamic Text Addition: Embed real-time data points within textual content on your board, offering live updates and insights. You can zoom into any metric and explore it further in the detailed view.
- Content Organization: Utilize dividers and the drag-and-drop feature to structure your board, making it intuitive and user-friendly.
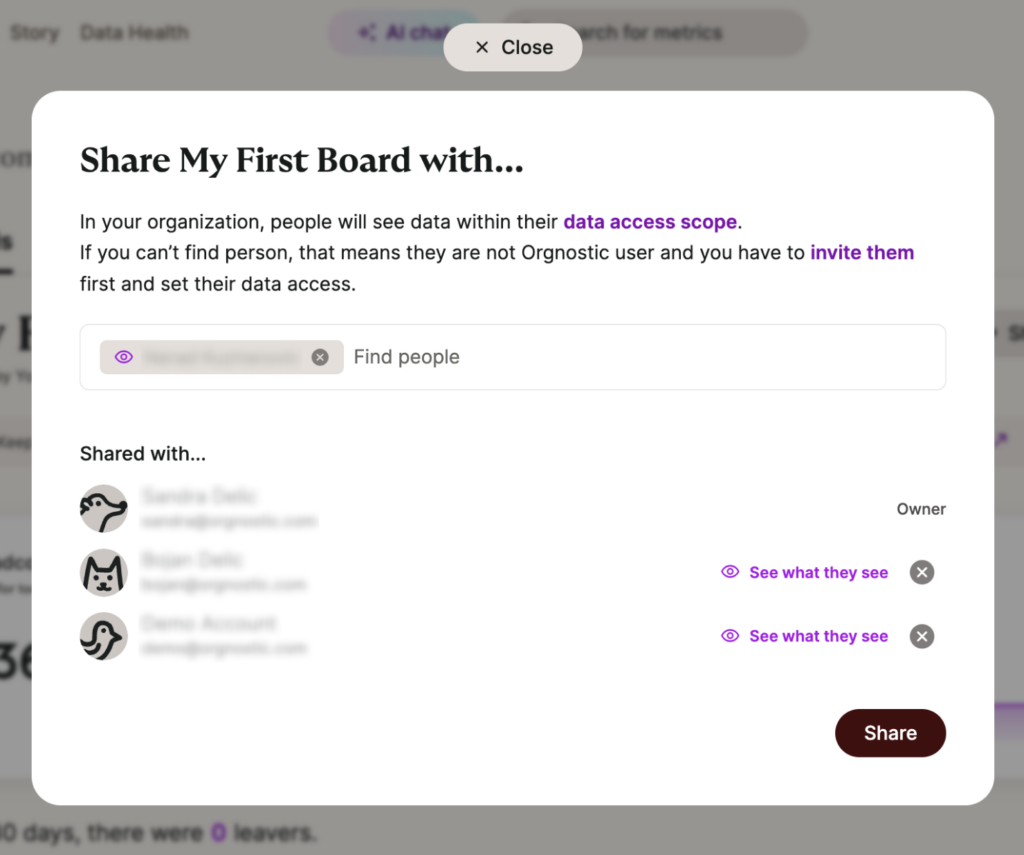
- Sharing Capabilities: Easily share customized boards with team members, fostering collaboration and an aligned understanding of key metrics.
Enhanced Custom Boards offer a suite of advantages, transforming the way data is personalized and interacted with.
- Personalized Insights: Dive deeper into data with customized metrics and visualizations, crafted to align with the unique roles and requirements of each stakeholder.
- Enhanced Decision-Making: Leverage targeted data that speaks directly to the core concerns of different departments, fostering informed, strategic choices that influence organizational efficiency and outcomes.
- Improved Engagement: Engage stakeholders more effectively by tailoring dashboard interfaces to their preferences, making complex data accessible and understandable, which in turn encourages more frequent interaction and use.
- Streamlined Storytelling with Dynamic Text: Innovate narrative reporting by embedding live, filterable metrics within your textual content, ensuring your stories are always supported by the latest data.
- Data Privacy and Security: Implement robust access controls to protect sensitive information, ensuring that data is shared responsibly and securely, in compliance with privacy standards and regulations.
- Scalability: Adapt your dashboards to accommodate organizational changes and growth, with the flexibility to introduce new metrics and adjust to shifting business strategies.
- Time Efficiency: Streamline data management processes, reducing the need for manual intervention and allowing teams to concentrate on strategic analysis and decision-making.
- Consistency in Reporting: Foster a unified approach to data interpretation across the organization, minimizing miscommunication and establishing a common analytical foundation.
Future plans: what’s next for boards?
While you’re reading this blog post, we’re busy developing new features for our Board!
Soon, you can expect an improved Sharing Capability. This means you’ll be able to share a Board not only with existing Orgnostic users but also with those who aren’t. We’re designing this feature with ease-of-use, security, and privacy in mind. You’ll be able to share via email or link.
In addition to enhanced Sharing, we’re also working on global filters. This will make all metric cards dynamic, allowing you to set filters and time ranges at the board level and apply them to each dynamic element on the Board swiftly. Instead of setting filters and time ranges individually, you’ll be able to do it in just a few clicks — a real time-saver!
We hope this post inspires you to harness the full potential of Custom Boards, making every insight and decision count.
For a more detailed walkthrough, book a demo and we’ll show you how you can start crafting your personalized data narrative.