Explore how our latest features can enhance data-driven decisions, focusing on unusual aspects of company activities and highlighting prominent employee segments.
Welcome to our latest update, which presents new features specially crafted to streamline your data analysis process. These tools are designed to help managers and leaders quickly identify where to focus attention, resources, and interventions.
We introduced two new features:
- Focus points
- Top/bottom employee segment detection
In the short video below, Mirta Stantic, Product Director of Insights at Orgnostic explains how these functionalities work and what they bring new.
Features Overview
Focus point detection is based on detecting deviations from a company’s usual functioning or trends of its key indicators over time. The feature helps detect and solve important pain points related to operational efficiency and employee satisfaction. By leveraging anomaly detection, businesses can enhance their responsiveness to changes, protect assets, optimize operations, and ultimately deliver a superior employee experience.
Understanding employee performance nuances across different metrics can be the key to unlocking unprecedented growth and efficiency in today’s dynamic landscape. Our innovative feature, designed to highlight the top and bottom employee segments within a selected metric, empowers managers and business leaders to harness the full potential of their workforce.
Focus Points
Anomaly detection is a powerful tool for deeper analysis, offering insights beyond traditional metrics. It is a process that identifies data points, events, or observations that deviate significantly from the usual behavior and indicates important organizational issues or opportunities.
Currently, the feature is implemented in the metrics with a timeline view. It is visible when you look at the metric visualization. You can decide whether to enable or exclude it from the metric visualization.
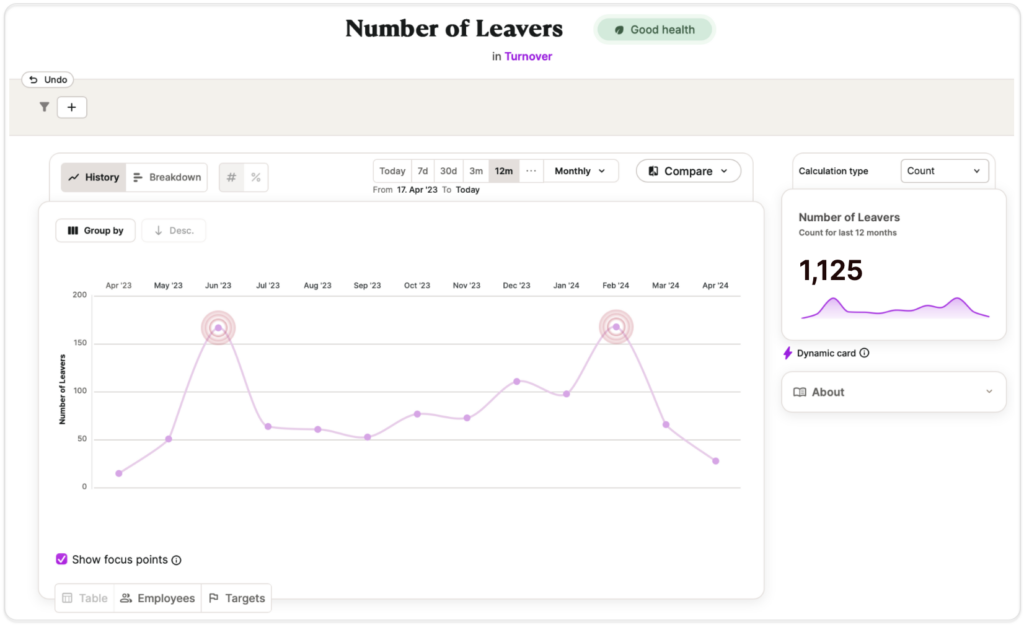
The feature serves as an insight that alerts users to unexpectedly low or high values in a broader range of metrics. Deviations could be in both directions – below and above the standard range.
In addition to alerting, you can obtain additional information on the extent to which the data point’s value is higher or lower than expected within the chosen time period.
The feature keeps all other functionality within the metric, such as filtering and time period selections, and adjusts presented information by preferred selection criteria.
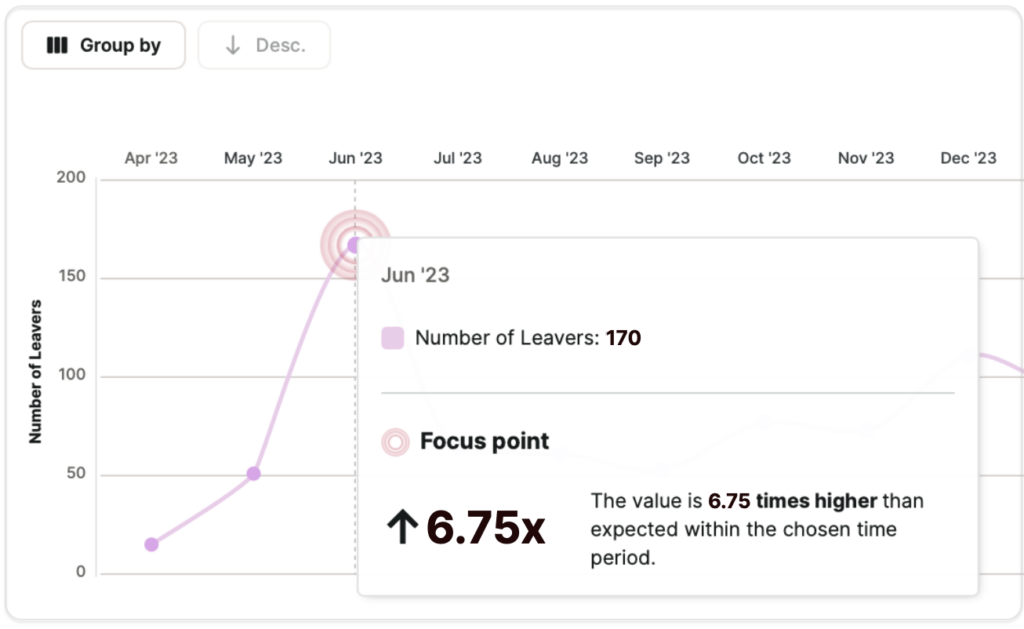
There are no additional prerequisites to have this feature within your account. Already existing data is validated to be sure that distribution is suitable for statistical analyses. We use Median Absolute Deviation – statistical analysis that helps to identify focus points. The median is selected as a more robust measure and less affected by outliers in the data set. Identifying focus points is tied to the time range you are focused on and your preference to look at absolute numbers or percentages.
What Do Focus Points Bring to You?
There are numerous benefits of having this feature:
- It enhances early problem identification by indicating potential problems, such as unexpected attrition increase, allowing quick intervention.
- Also, Focus points can identify exceptionally performing segments of the workforce, offering insights into best practices and strategies that can be replicated.
- By clearly understanding data patterns and outliers, managers and executives can make more informed decisions about training, resource allocation, and strategic planning.
- Focus points can serve as a base for search to unveil the root causes of anomalies, empowering you to make informed decisions.
- Anomaly detection can also enhance employee experience by identifying unusual patterns in employee behavior or satisfaction metrics. This can lead to a deeper understanding of employee needs and preferences, enabling businesses to tailor their offerings and interactions for improved satisfaction and loyalty.
The feature could be very useful in situations such as checking the seasonality of unplanned leaves within your organization. The focus points feature helps you check if you have any specific periods with more unplanned leaves than usual.
Top/Bottom Employee Segmenting
Our top/bottom employee segment analysis is meticulously designed to provide a clear, actionable snapshot of your workforce’s performance. This feature effortlessly identifies the highest and lowest-scored employee segments within a specific metric, enabling targeted interventions. Whether you’re looking to boost sales, enhance employee satisfaction, or improve operational efficiency, our analysis pinpoints precisely where your strengths lie and where there’s room for improvement.
The set of currently supported metrics includes:
- Headcount
- Headcount Cost
- Number of Open Positions
- Number of Starters
- New Hires Ratio
- Unplanned Leaves
- Cost of Unplanned Leaves
- Number of Leavers
- Turnover
- Tenure
We are constantly improving the functionalities, so the implementation can be expected soon in other metrics.
Here is an example of how it looks on the platform:
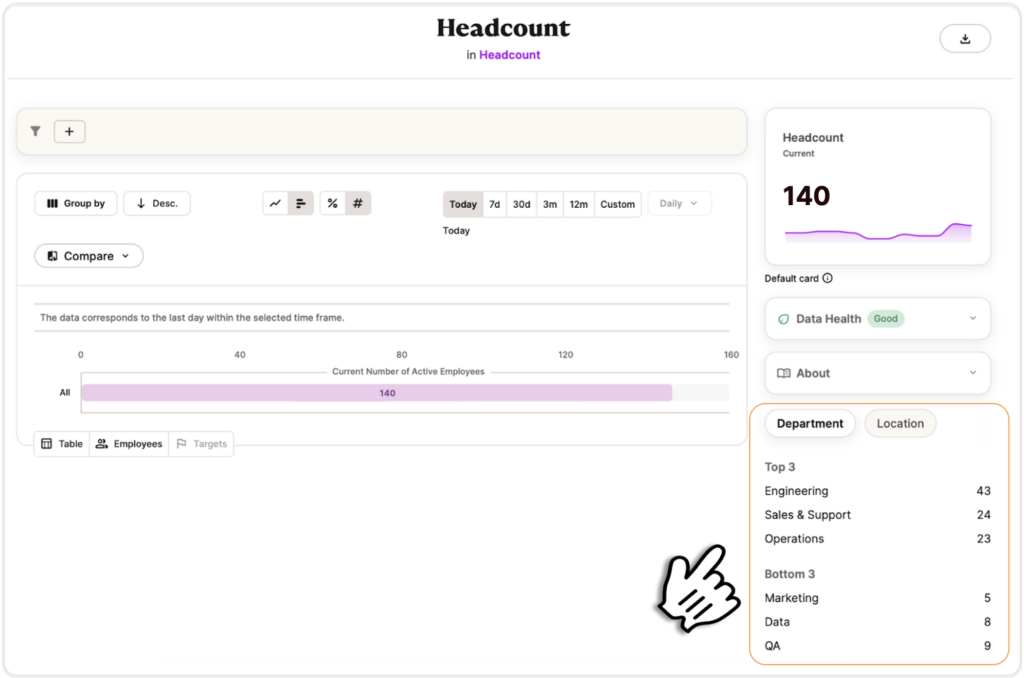
The default view shows employees segmented by department, location and team if those options are available within an account.
Segmenting the data by relevant categories can uncover specific patterns and issues that might not be visible in a company-wide analysis, allowing for targeted interventions and more effective strategies. There is a possibility of selecting a range of employee segments based on demographics or criteria related to different aspects of employment.
As for identifying focus points, there are no additional prerequisites to show top/bottom grouping in your data. We use descriptive statistics to sort selected employee segments based on their scores on the metric you are interested in. The top/bottom 3 levels of identification are set by default. Still, it may vary depending on the number of levels within the employee segment (E.g., for grouping by gender, the feature identifies just the top and bottom segments).
What Does Top/Bottom Employee Segmenting Brings to You?
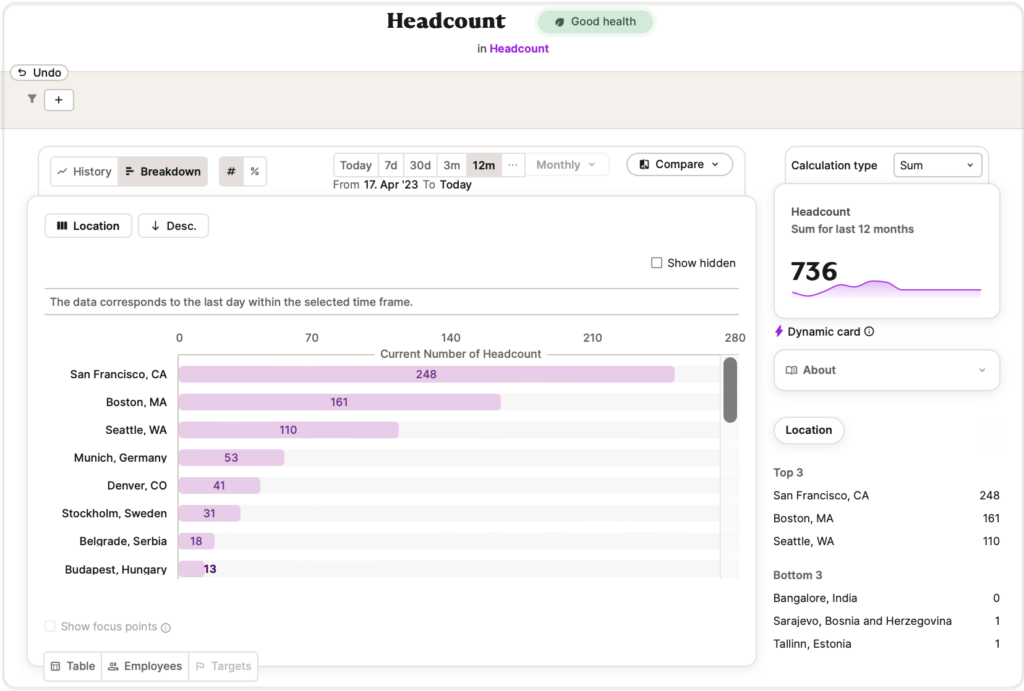
Our new analysis tool is a time-saving solution for business leaders and HR professionals. This feature is designed to allow you to quickly and efficiently identify the highest and lowest performing segments within given metrics, eliminating the need to sift through extensive data or complex graphs manually.
By presenting the top and bottom segments in a straightforward, easily accessible format, our tool lets you immediately grasp important insights about your organization’s performance. It is especially helpful for organizations with many departments, locations, or teams. At a click, you can get highlighted segments with the highest or the lowest number of employees or leavers and other interesting information you need.
At the end
If you want to see these features in action, go to http://orgnostic.com/demo to schedule a walkthrough.
We’re happy to show you around! Embrace the power of precise, data-driven insights to make informed decisions, foster a culture of continuous improvement, and confidently achieve your business objectives.