Summer is for seas, cotton candy — and people analytics. Here’s a rundown of our very first People Analytics Challenge, discussions, insights and solutions that surrounded it, along with announcing the winners!
On the back of our People Analytics Masterclass Series — which saw a whopping 3,000 people (and counting) come together and learn about people analytics from leading industry experts and peers, we headed straight into the Summer People Analytics Challenge.
Our goal?
To create a space for the “people people” to solve real-life business cases and put their new people analytics skills to the test.
It was a great journey — and we hope you’ve enjoyed it as much as we have. So, before we look at some of the key moments and announce the winners — a big thank you to all those who took the time to work on the challenge from your friends at Orgnostic!
Tl; dr — if you’re eager to see who will be going to HR conferences in Las Vegas and Copenhagen, scroll away and check the winners’ names at the end of this post.
But, we also nudge you to then come back and read through the discussions and insights we’ve had throughout the challenge, as they are a lot of fun and we can all learn a lot from them.
The Three Quests
To keep the momentum of the People Analytics Masterclass Series going and give a chance to the students and other people analytics enthusiasts to work on real-life people analytics use cases, we selected three common scenarios encountered across organizations and HR departments.
Enter High Attrition, High Growth, and Absenteeism.
Each of these challenges was structured to mimic real-life work of data-driven HR teams and people analysts.
Within each challenge, participants were given a scenario to work on. They then had to set up the tools, identify the questions to answer, collect data, define HR metrics, manipulate data and work out the metrics, interpret the data, and decide on next steps.
At the end of the challenge, they were asked to put together a presentation for the executive team outlining the most impactful insight they’ve uncovered, including the data behind the insight, the insight uncovered, and proposed solutions — an action plan.
Here’s a quick recap of each of the challenges:
Challenge 1: Tackle high attrition
Analyze the reasons behind a company’s high attrition and suggest an action plan for retaining the employees.
Scenario: You’re working for a logistics company, coordinating deliveries across the USA. The customers of your organization started complaining about the service they are getting. They are unable to reach support (internally known as Operations department) when needed and get accurate information about shipments and deliveries. Your customer NPS (net promoter score) dropped from 85 to 40 in the last year. The biggest issue reported by the customers is lack of support and timely reaction for their escalations.
While speaking with business stakeholders, you came up with a thesis that the NPS trend is in relationship with high attrition rates and employees who are constantly leaving. You are losing a lot of internal knowledge and this has started to become visible to clients as well.You have an executive meeting in 7 days and all executive leaders are asked to present their analysis and suggestions for overcoming this challenge from different perspectives: customer, product/service, people, finance etc.
Questions for analysis:
- What is your attrition trend and turnover rate?
- Where are you losing most of your employees?
- Which department lost the most internal knowledge (tenure) because of turnover?
- Which department has the lowest engagement scores?
- How does our employee NPS compare to customer NPS?
- What are the most common reasons your employees are leaving? What are they willing to trade when leaving?
Challenge 2: Plan for high growth
Position an organization for high growth by ensuring this growth happens and the company manages to hire per its hiring plan.
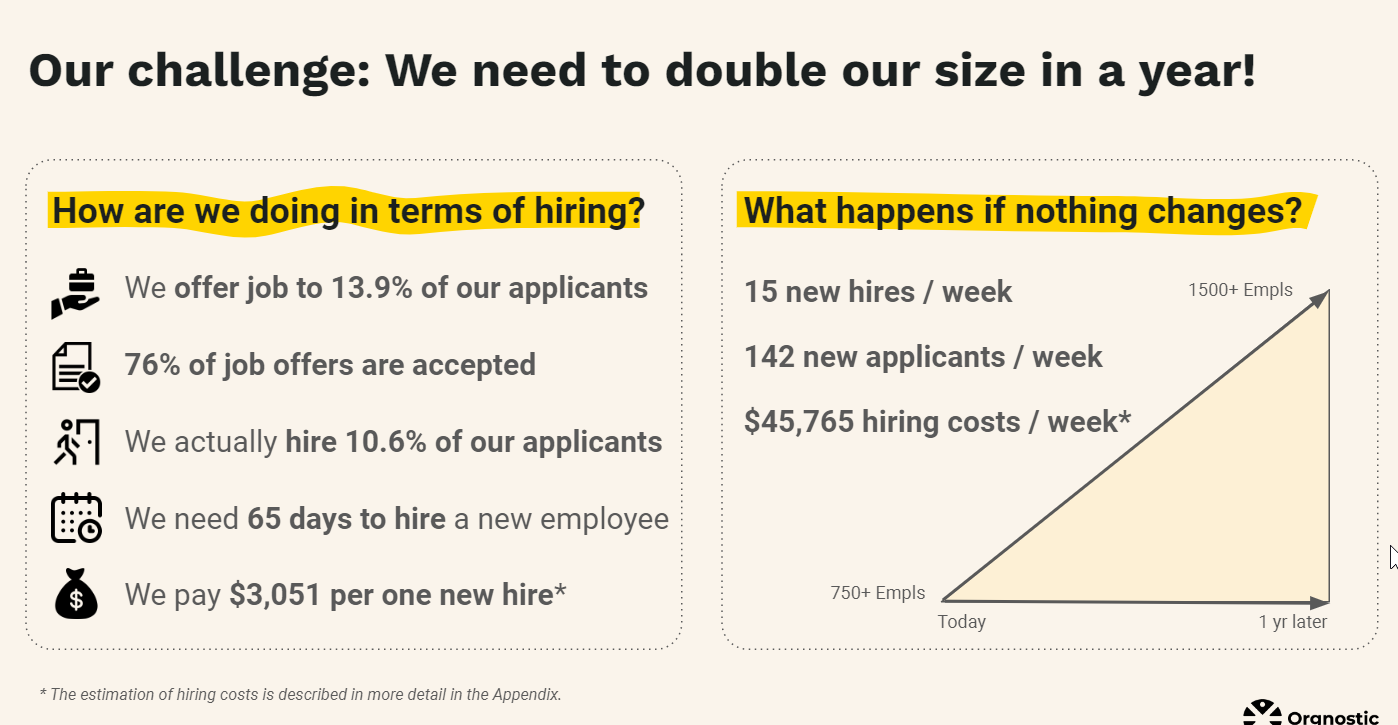
Scenario: You’re working for an IT scaleup that has 750+ people and is growing fast. This year, you aim to double the size of your workforce to meet the growing needs of the business. As the Chief People Officer, you are responsible for ensuring this growth happens and the company manages to hire per your hiring plan.
Questions for analysis:
- How much time do you need to make a hire?
- How many hires do you need per week across your company to be on top of your total workforce growth goal?
- How many candidates do you need to source and screen on a weekly basis to get to this goal?
- Which sources should you focus on? Which sources proved to be the most efficient in the past?
- Where are your hiring bottlenecks? Do you have issues with the top, middle, or bottom of the recruitment funnel?
- Which source would you choose as the primary source of candidates and double your investment in it to achieve high growth?
Challenge 3: Curb absenteeism
Understand if the increased leaves at a company are a symptom of a deeper issue that needs tackling, and analyze their impact on the organizational cost.
Scenario: Leaders asked HR for help with new hires or temporary replacements to be able to support the workload in their teams since they have unusually high absenteeism. This is directly impacting the workload they can handle, as well as the individual workload of other team members who step in to take over the load.
As the HR in charge, you’ve decided to make a detailed analysis of absence. By doing so, you want to understand if these leaves are inevitable or if there might be an abuse of the system. You would also like to understand the impact on organizational costs.
Questions for analysis:
- Which type of leave is the predominant in the company?
- What is the relation between planned and unplanned leaves? (In this company Unplanned leave is usually considered to be sick leave, sick child, caregiving, personal emergencies, bereavement leave, personal time off, and similar.)
- Are there any departments or roles that have significantly higher absenteeism rates compared to the rest of the company?
- How is the cost of absenteeism impacting your bottom line?
- Is there a relationship between absenteeism and turnover?
If you want to try your luck and undertake the challenges yourself, you can find complete instructions for all the challenges below:
Questions people asked — and insights that followed
In addition to ongoing discussions in our Slack community, the People Analytics Lounge, we organized two live peer discussions on Zoom to allow the participants to chat and discuss their solutions, answer questions, and learn about different perspectives.
These questions and insights shed different light on the ongoing challenges.
But more importantly, they also added value to a more general approach to people analytics — so we want to share them with you here:
On analyzing attrition. When analyzing attrition, it is beneficial to include performance management insights. For example, this allows you to see any potential correlation between attrition peaks and the performance review cycles since there is often a turnover peak right after a performance review cycle.
On measuring performance. When it comes to measuring performance, it’s good to use signals such as whether people are submitting their performance reviews, whether they’re late, what are the engagement rates, as well as looking at exit surveys.
On the banes of spreadsheets. One of the participants pointed out that, from their vast HR experience, the pain with spreadsheets is the effort and time it takes to crunch data in and not only that, but also the data getting old by the time it gets to stakeholders, so they found using a people analytics platform like Orgnostic very helpful as the calculations are already done for you and you are working with fresh data from your tools.
On demonstrating business value. It’s important to align the rest of the data with financial numbers in order to capture the attention of the executives and show the impact on the bottom line of the organization.
On metrics to track attrition. Getting relevant data for external benchmarking can be challenging, so it’s best to start from internal benchmarking – for example, if your turnover rate has significantly increased compared to your turnover rate from the previous year, this can be an indicator of high attrition, and measures should be taken to prevent further turnover. It’s also good to look into whether there is a trend that may be impacting a specific department or division within the company. Here, you need to look at reasons why employees are leaving on company level, but also on department level. You can also take a look at tenure, drill down into the data, and see if you are losing a lot of people who are for example within their first year in the organization. In that case, it’s likely that you have a problem with recruitment or onboarding, which brings specific costs related to replacement hires that are constantly preventing you from growing the organization further.
Focus on retaining people during high growth. When working on the impact of turnover on high growth, it’s important to focus on how you are going to retain people with the high growth policy and what is the capacity needed to also make rehires.
There are four things that you should generally diagnose in the high growth/hyperscale preparation:
- recruitment process and efficiency
- onboarding capabilities and capacities
- turnover
- and leadership development
Look for turnover reasons in rewards and management span of control. When diagnosing turnover reasons, look into rewards and promotion policies, as well as the management span of control, as they can be a symptom of the organizational and process design setbacks. The span of control issue might indicate that you are also missing the concept of the “real team”, which might suggest that you should run team effectiveness surveys or similar analysis.
Keep action points… actionable. Always make sure that you have an immediate action point as a result of your analysis so that it doesn’t appear as an academic research that might cause some setbacks among management structures.
Be clear about hypothesis and explanations. Looking beyond the usual suspects in your analysis is a great way to find hidden symptoms affecting your organization — but it’s crucial that you keep things clear. For example, if you’re exploring a metric such as management span of control, your case should include a brief explanation of the metric, how it negatively affects your organization, and what you do about it. A bit more development and expressions of the ideas in the analysis and action points is the way to go.
Refine your problem statement. Before suggesting improvements, you need to get people to buy the idea and the problem.
And you can do this through a strong, relatable problem statement that resonates with management / finance departments.
For example, if you’re working out on curbing absenteeism, your analysis should speak to:
- What would be the estimated cost of absenteeism?
- In what ways is that affecting the team and how is it a problem to the business?
- If the pattern you have analyzed leads you to think it is an early sign of burnout, then what would be the impact of burnout on turnover rates and how much would that cost business in terms of productivity or replacement hires?
Insights that are worth a mention
Before we look at some of the insights that stood out, we wanted to take a moment and congratulate and thank everyone for submitting remarkable work.
With that said, here are some of the gems that caught our attention.
Ludek took a great approach by asking What happens if nothing changes? This is an excellent example of tying together financial and business impact with HR practice:
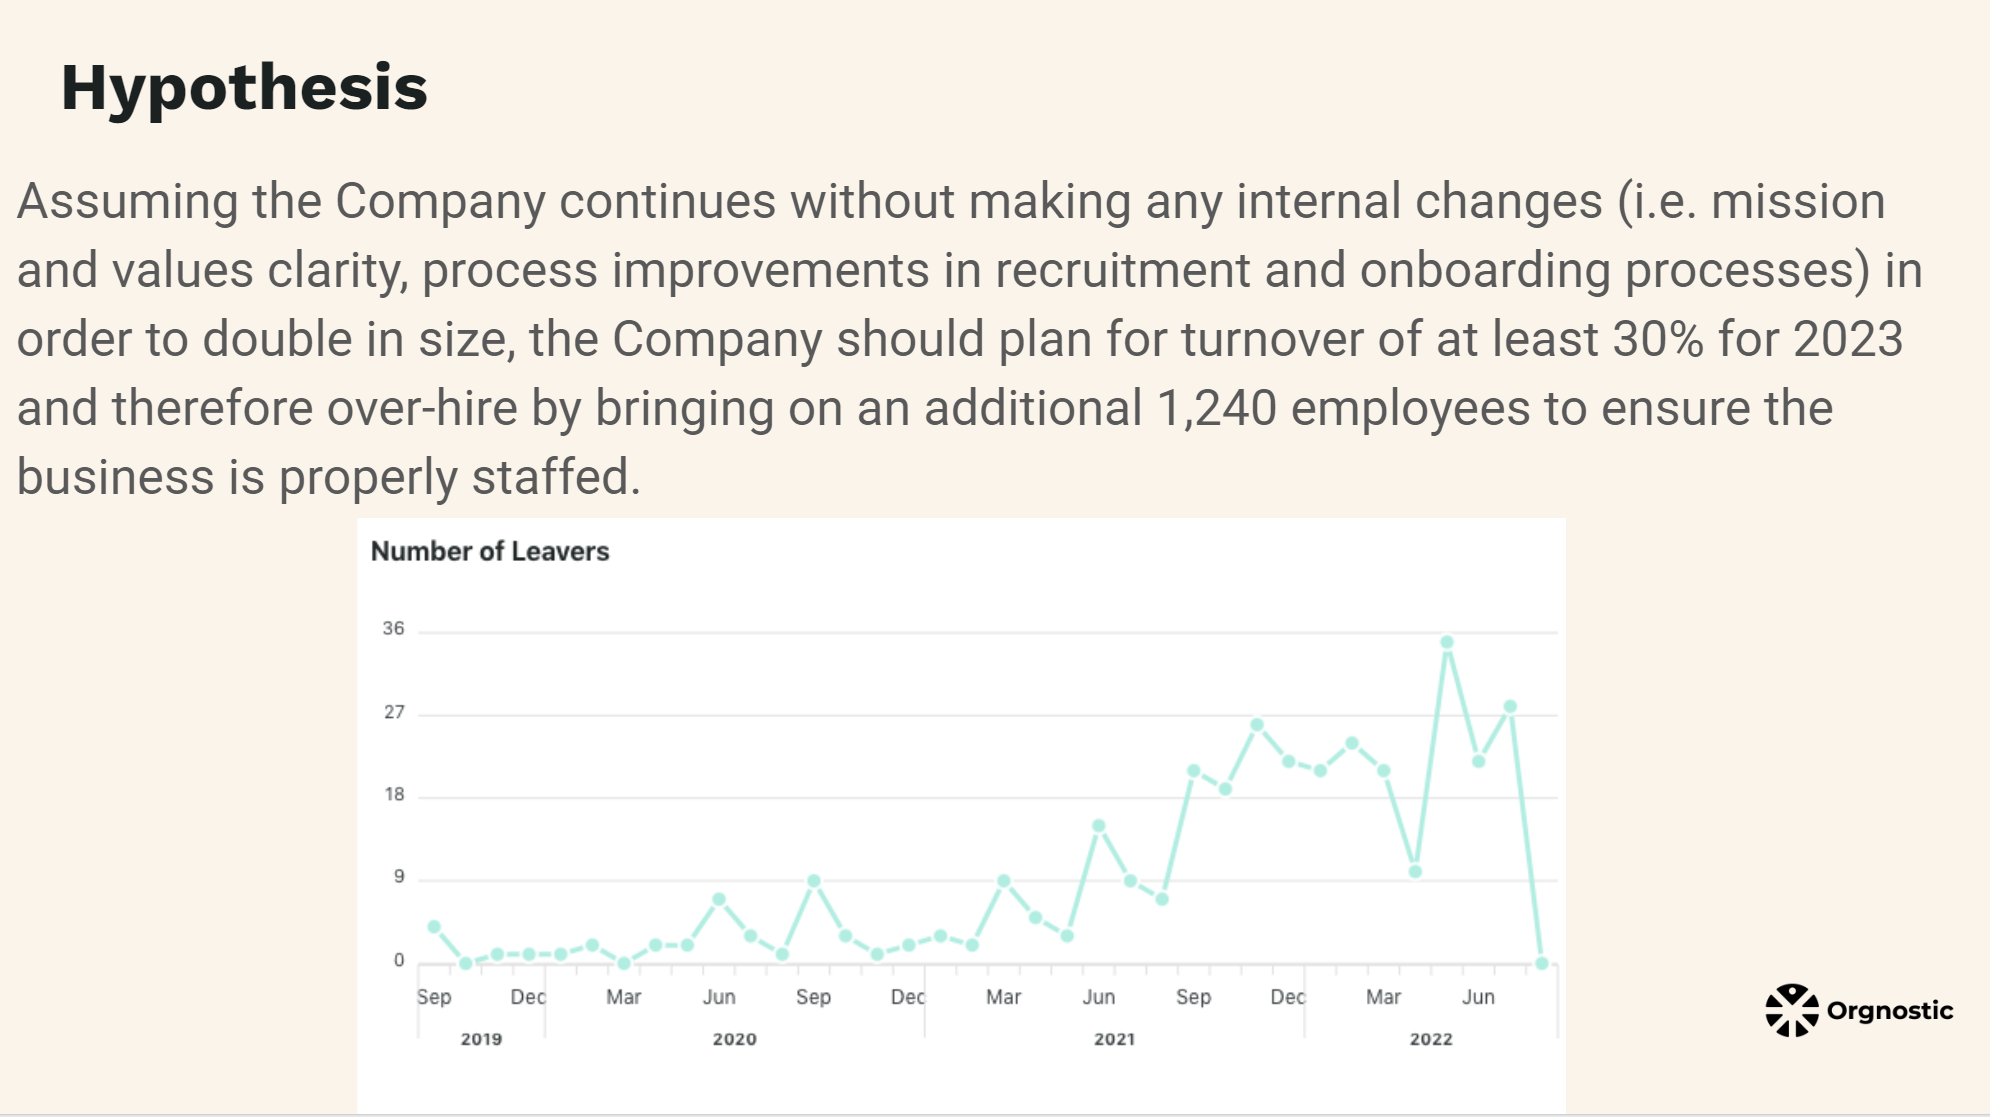
Elizabeth had an excellent point that it is important not to be too narrow in your analysis and look at hiring only as a recruitment issue. Instead, she took a holistic view of the data and determined that doubling in size, when coupled with turnover figures, means that the number of people to hire and onboard would have to be significantly higher:
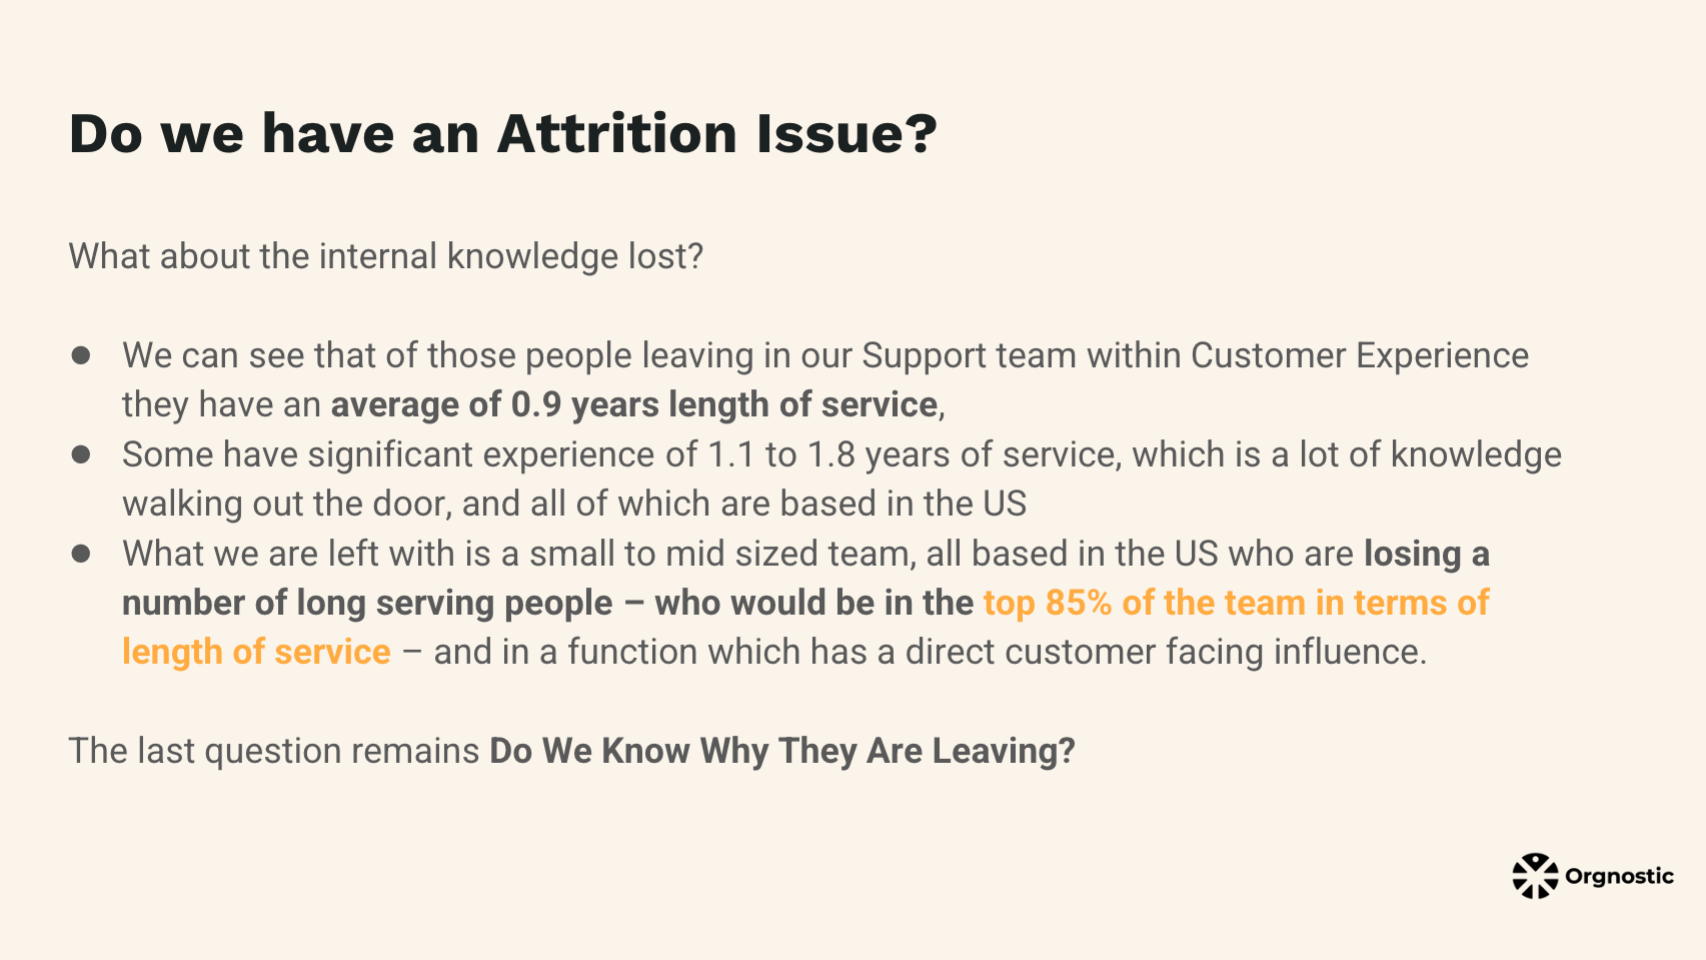
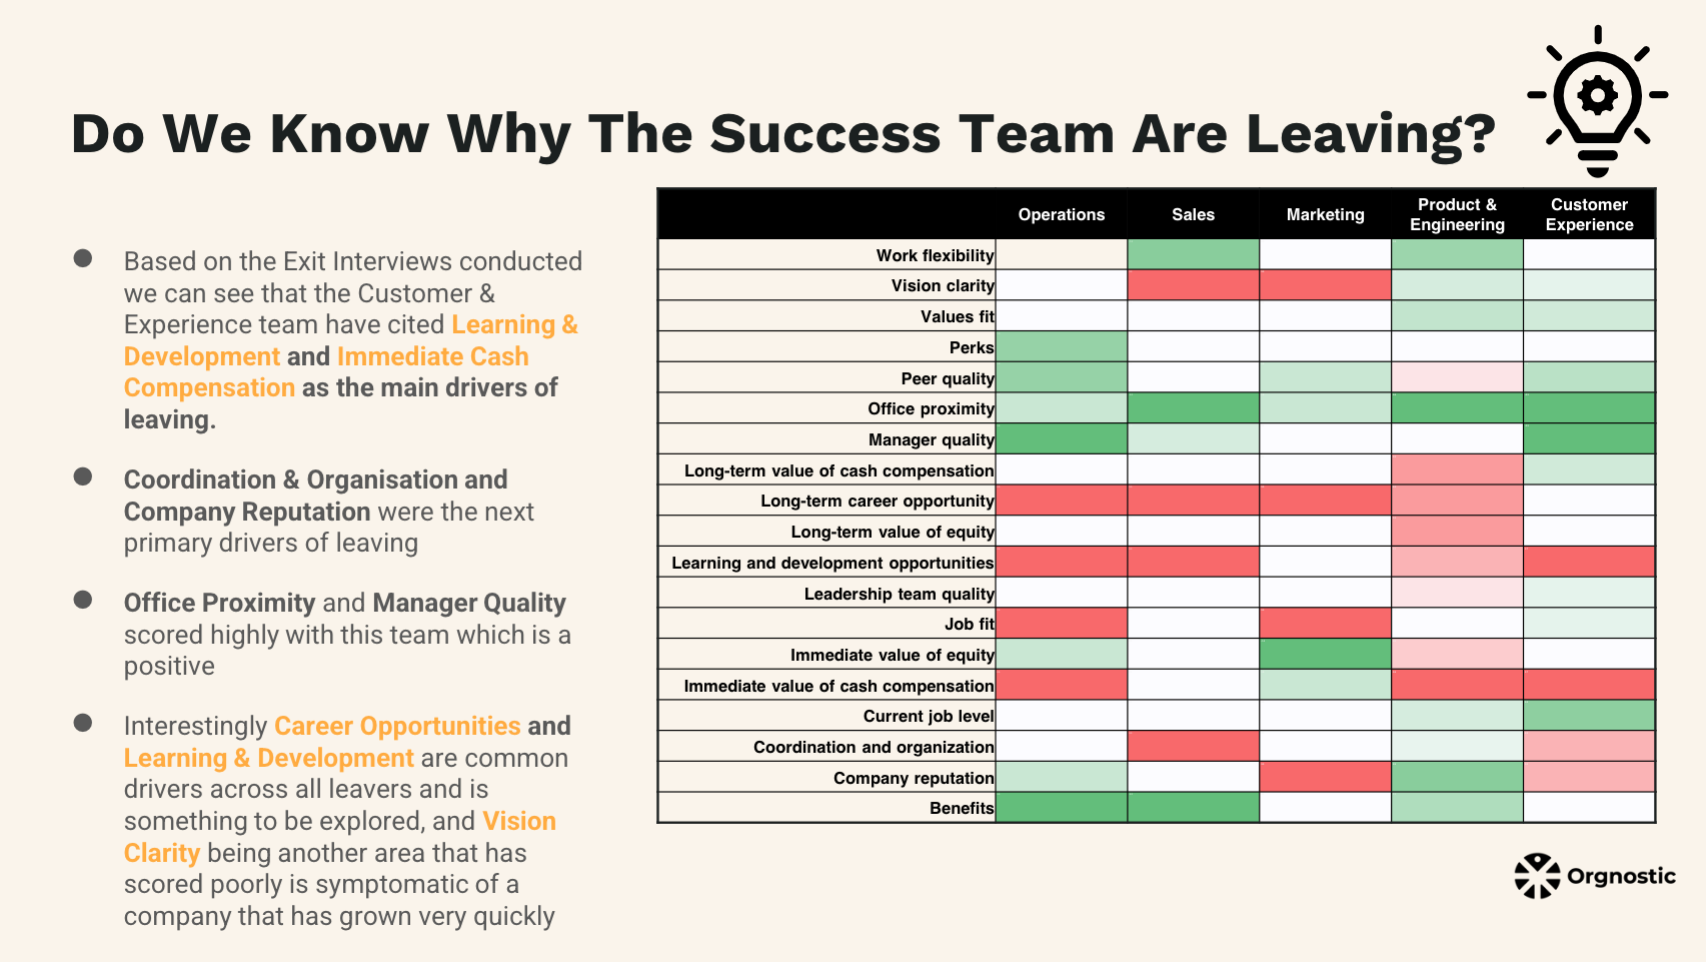
Stephen brought his A-game to the flow and clarity of analysis, weaving in experience loss into the equation, finding a common thread in exit reasons, and tying together vision clarity and the speed of company growth:
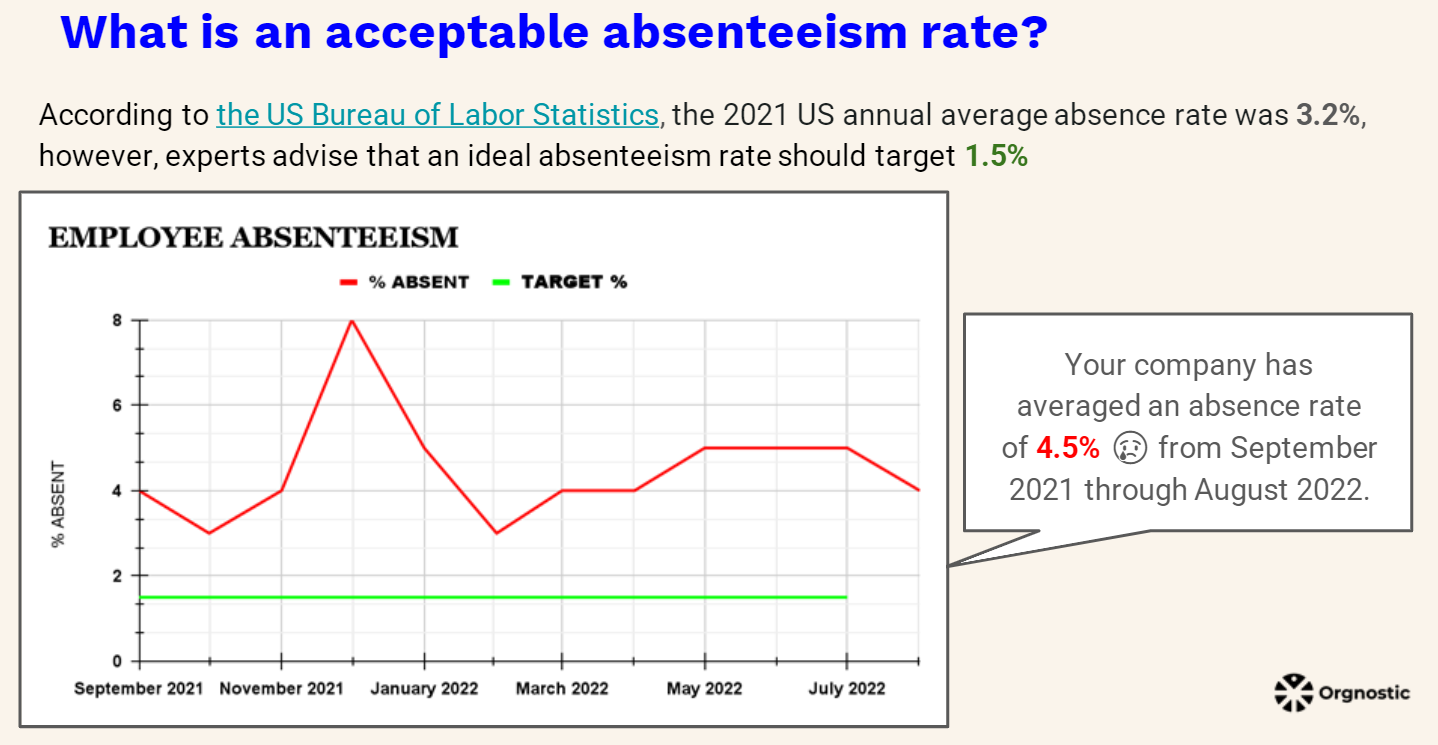
To raise awareness of the impact of absenteeism, Rachel included external data that show the magnitude of the issue of absenteeism in the organization:
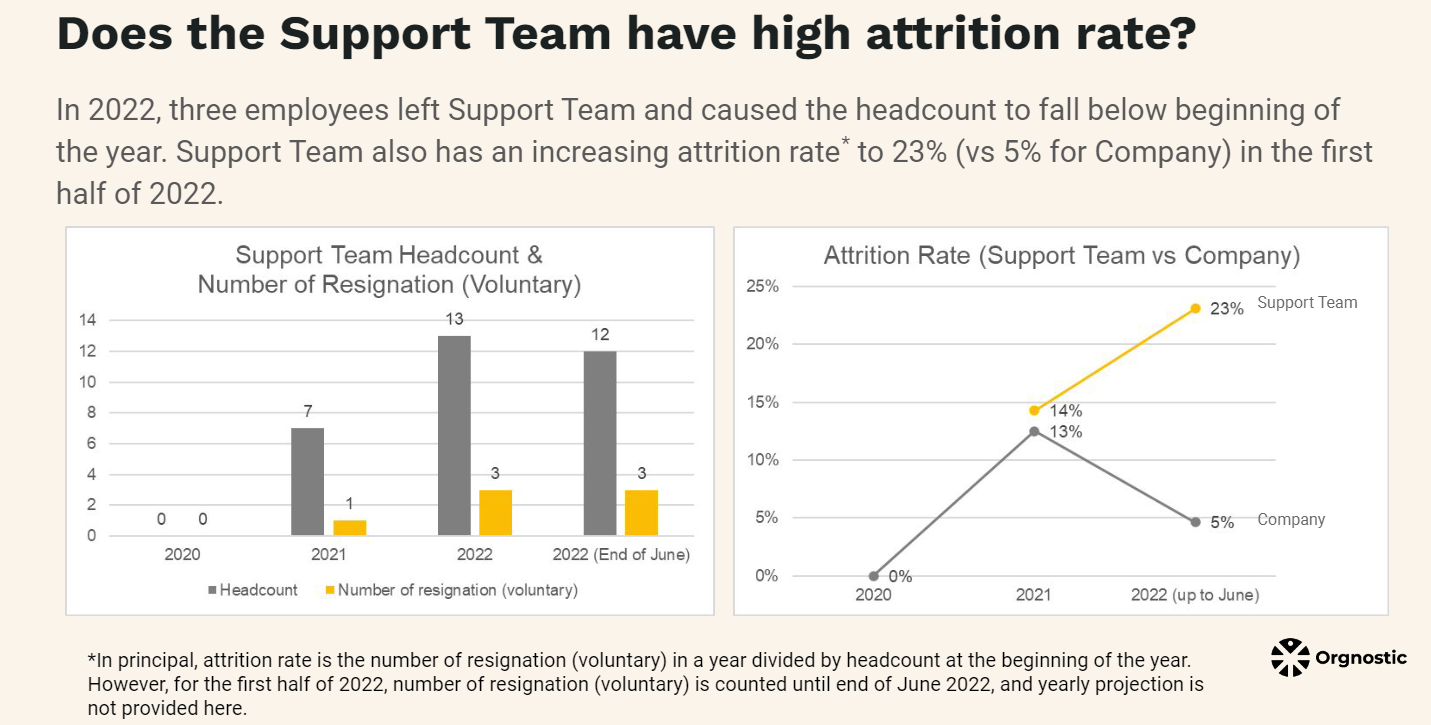
Working on the attrition challenge, Aulia included internal benchmarks and showed how different teams compare to the company overall, to determine whether the company was actually facing a high turnover issue:
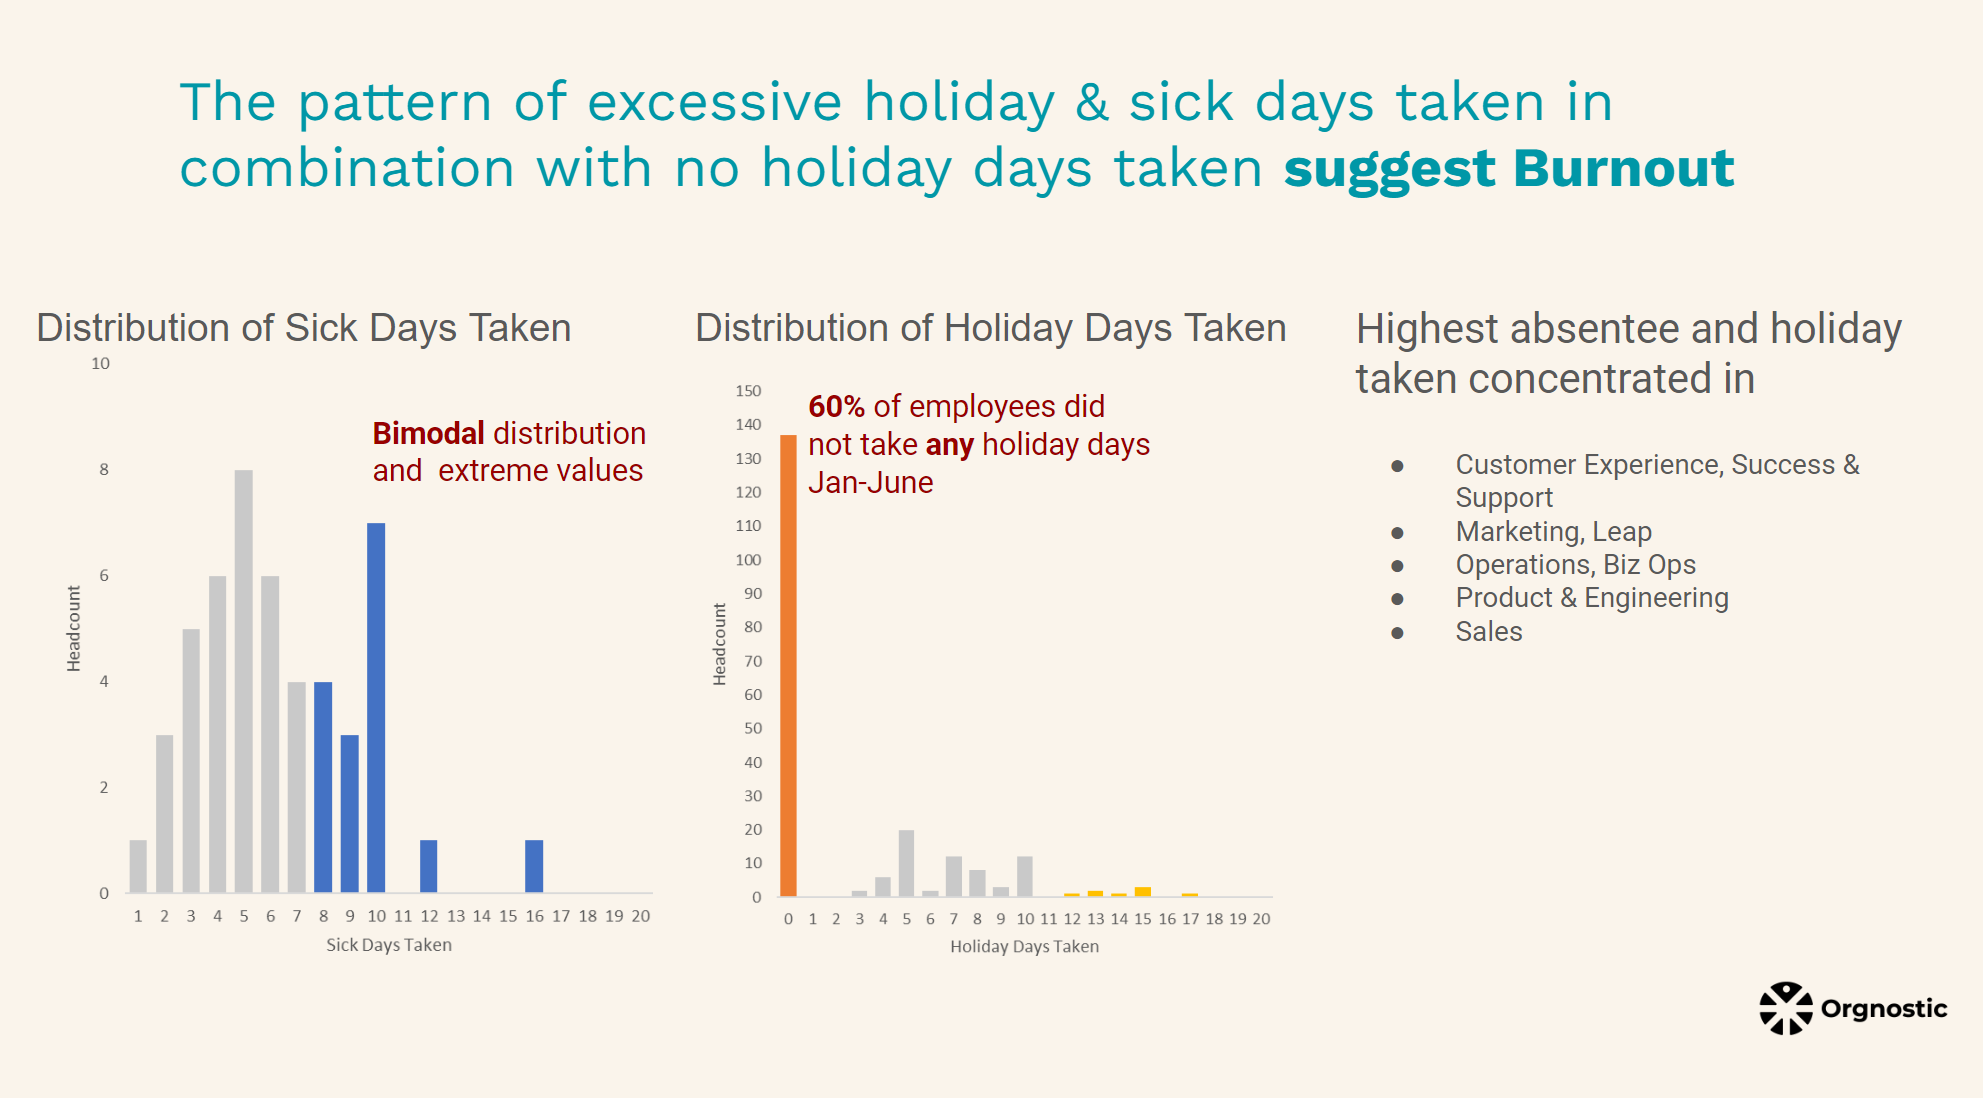
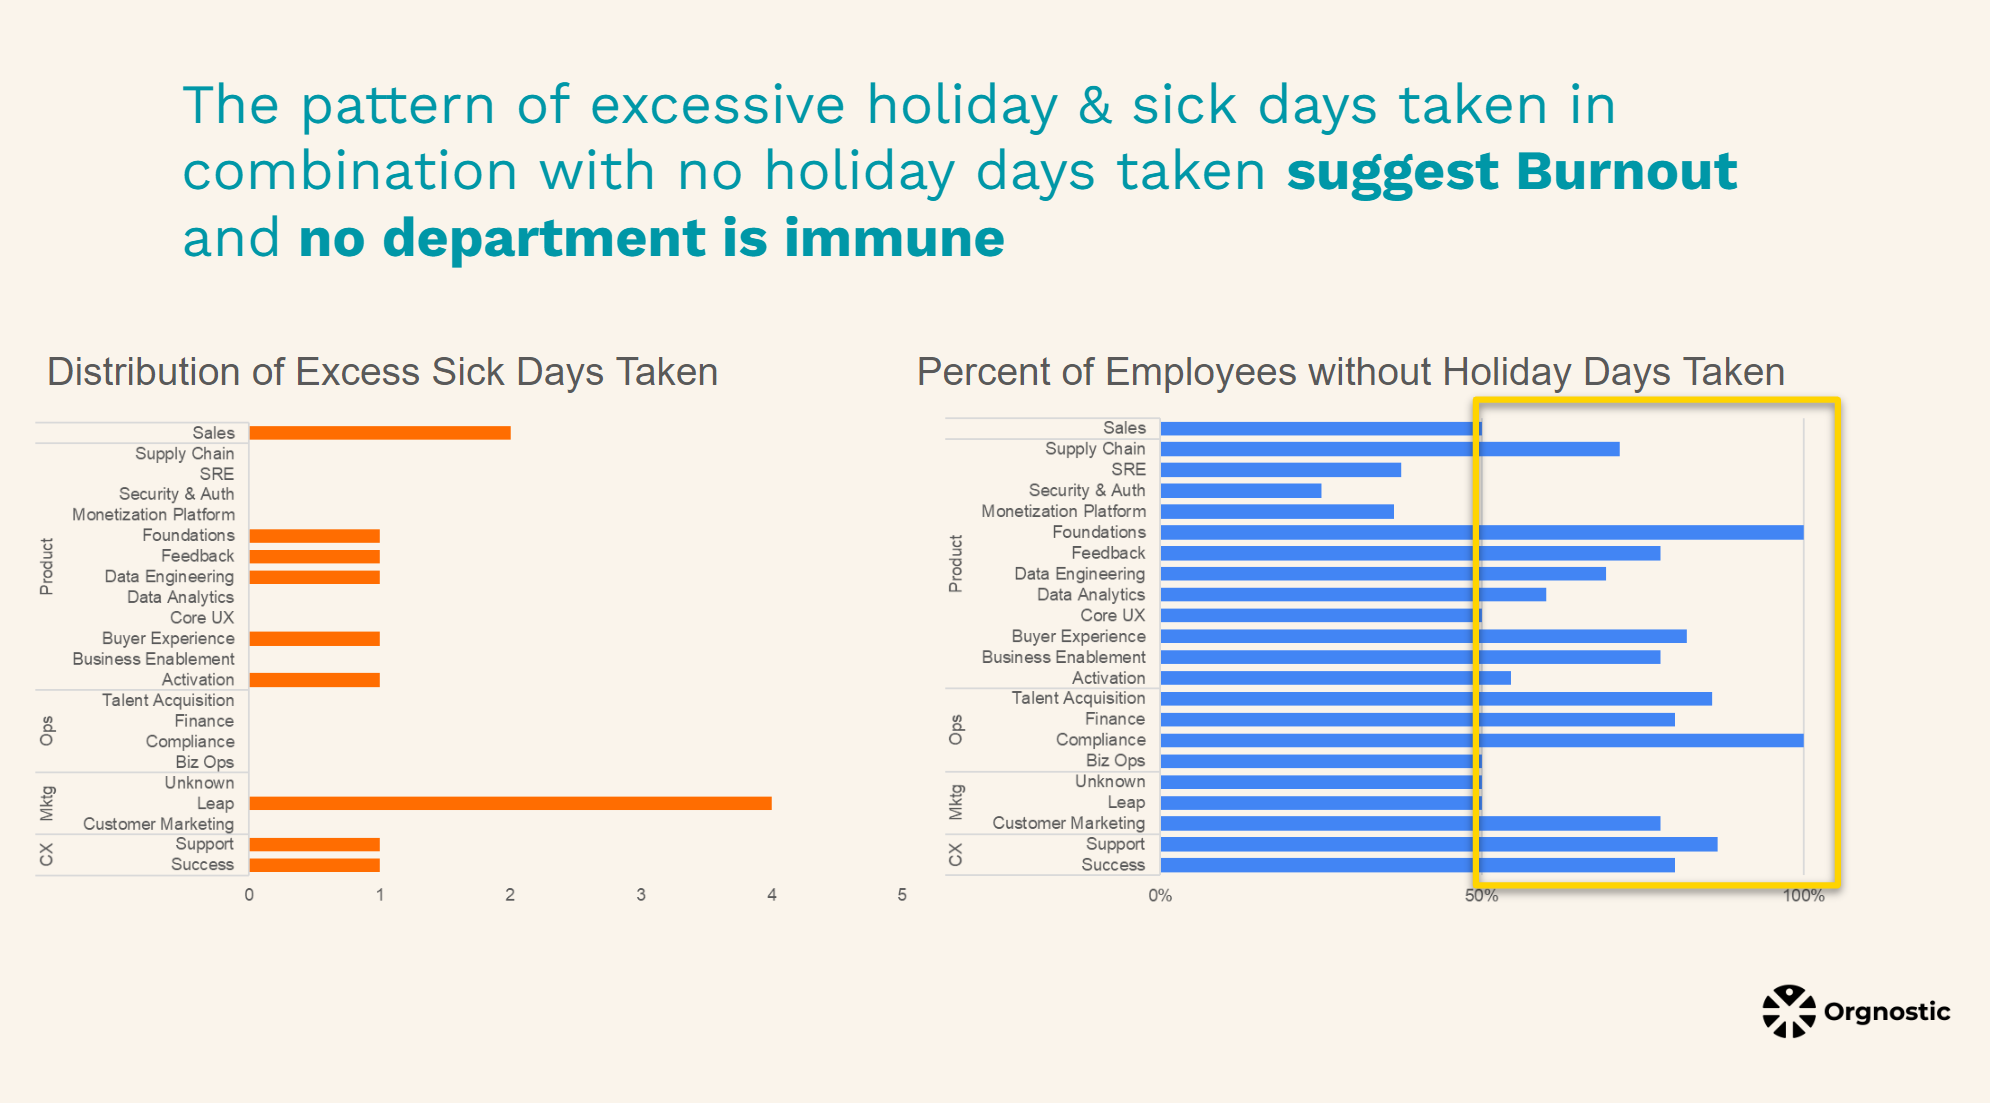
When analyzing absenteeism, Alejandro decided to look at the other side of the medal too — he included data on the percentage of people who took no day off over the last six months, in addition to the expected absence and sick days analysis:
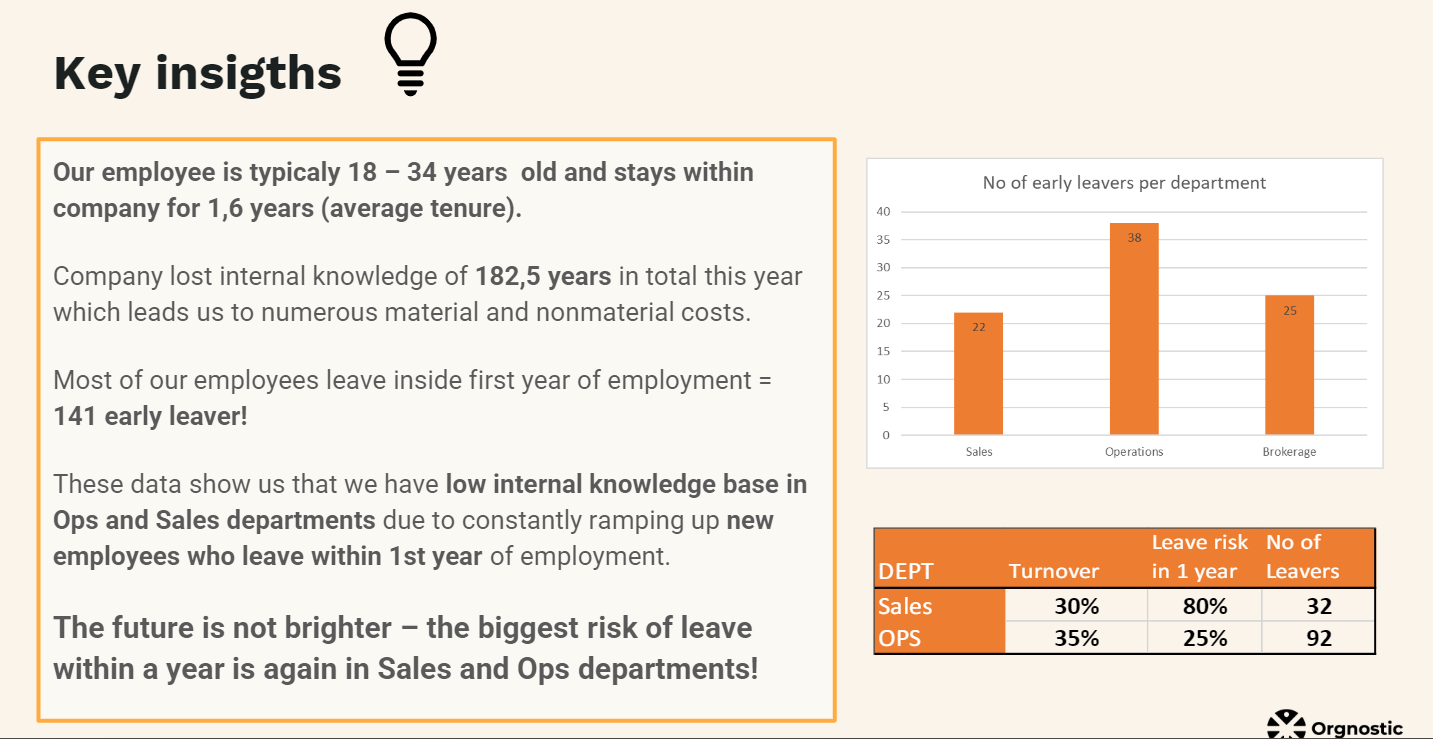
Nikolina uncovered a real gem of insight when analyzing turnover. She looked at the number of years of experience within a department lost through turnover by working out the experience loss metric — that way, she showed just how much knowledge is lost and how increasingly difficult it is to onboard new hires:
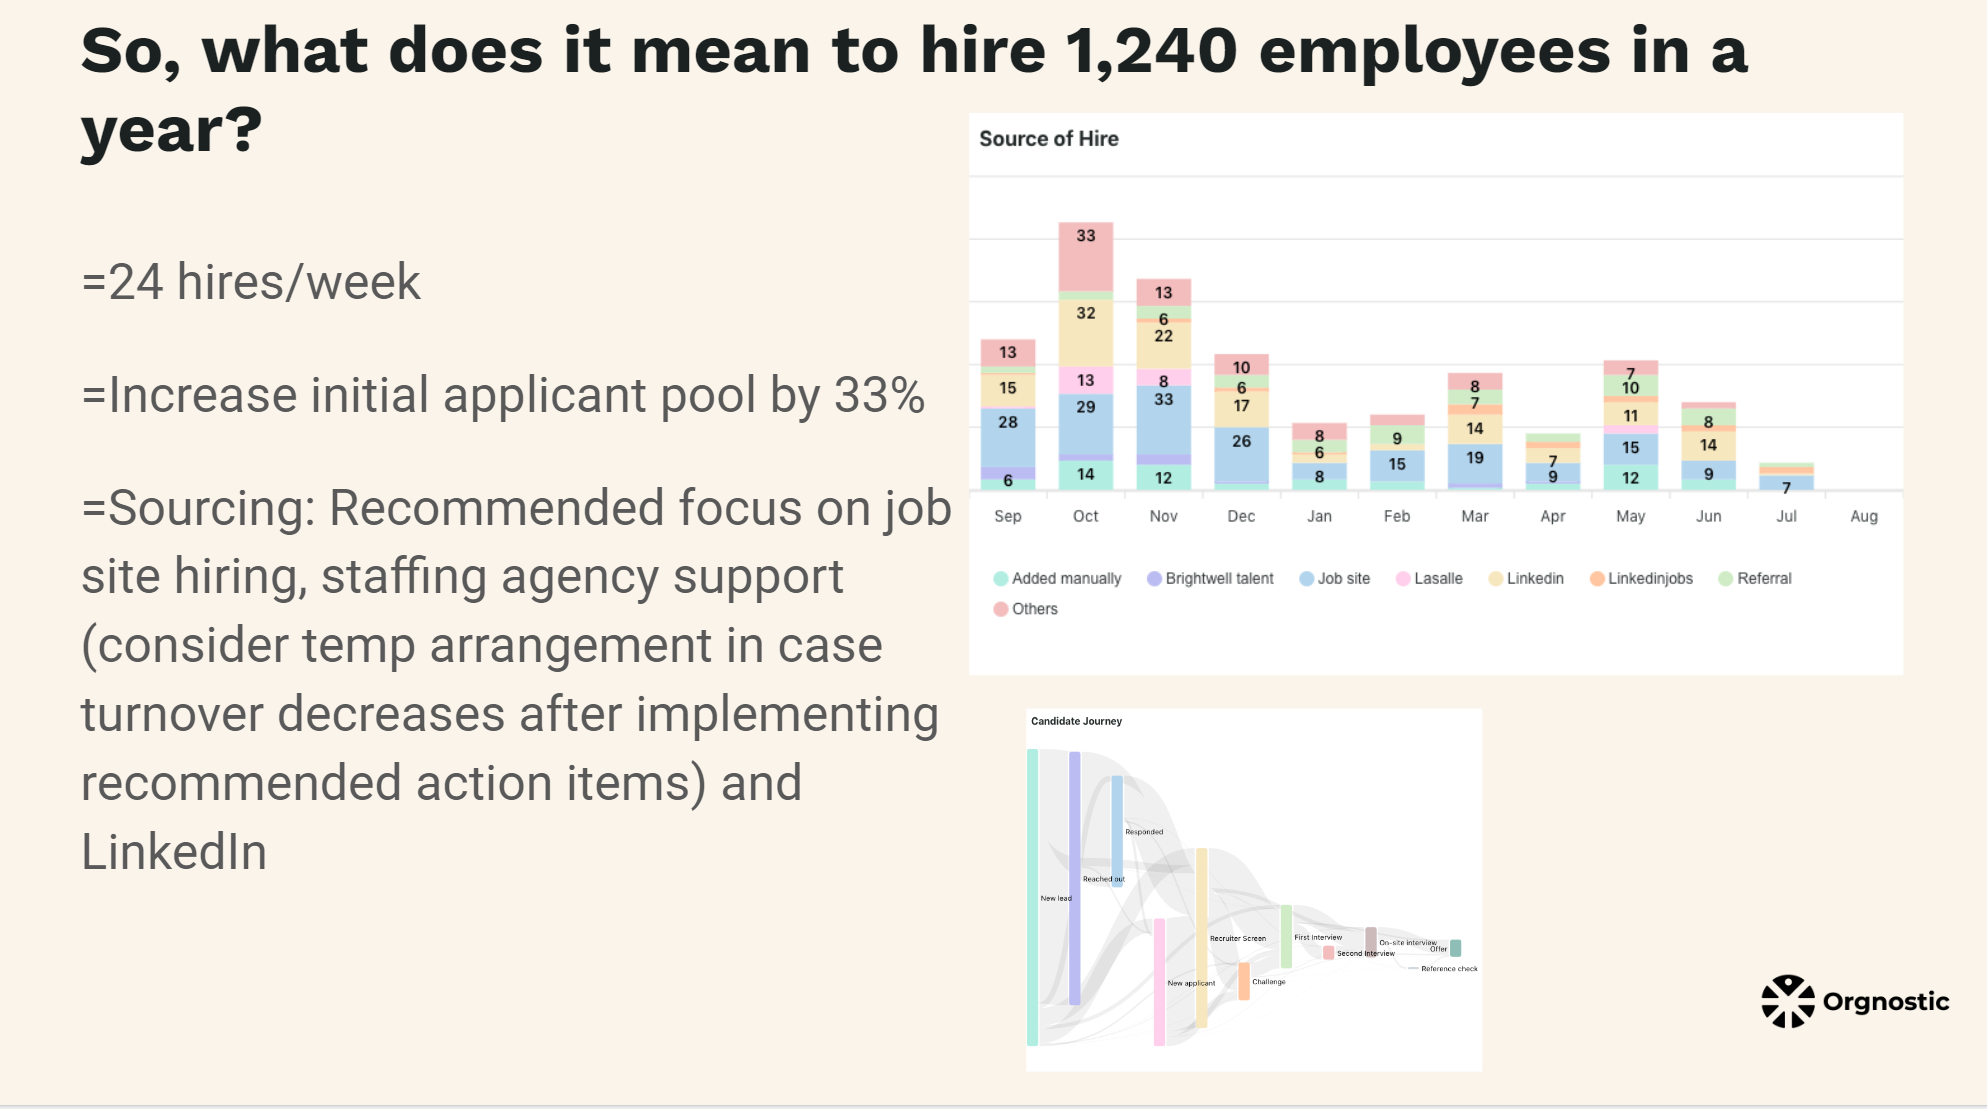
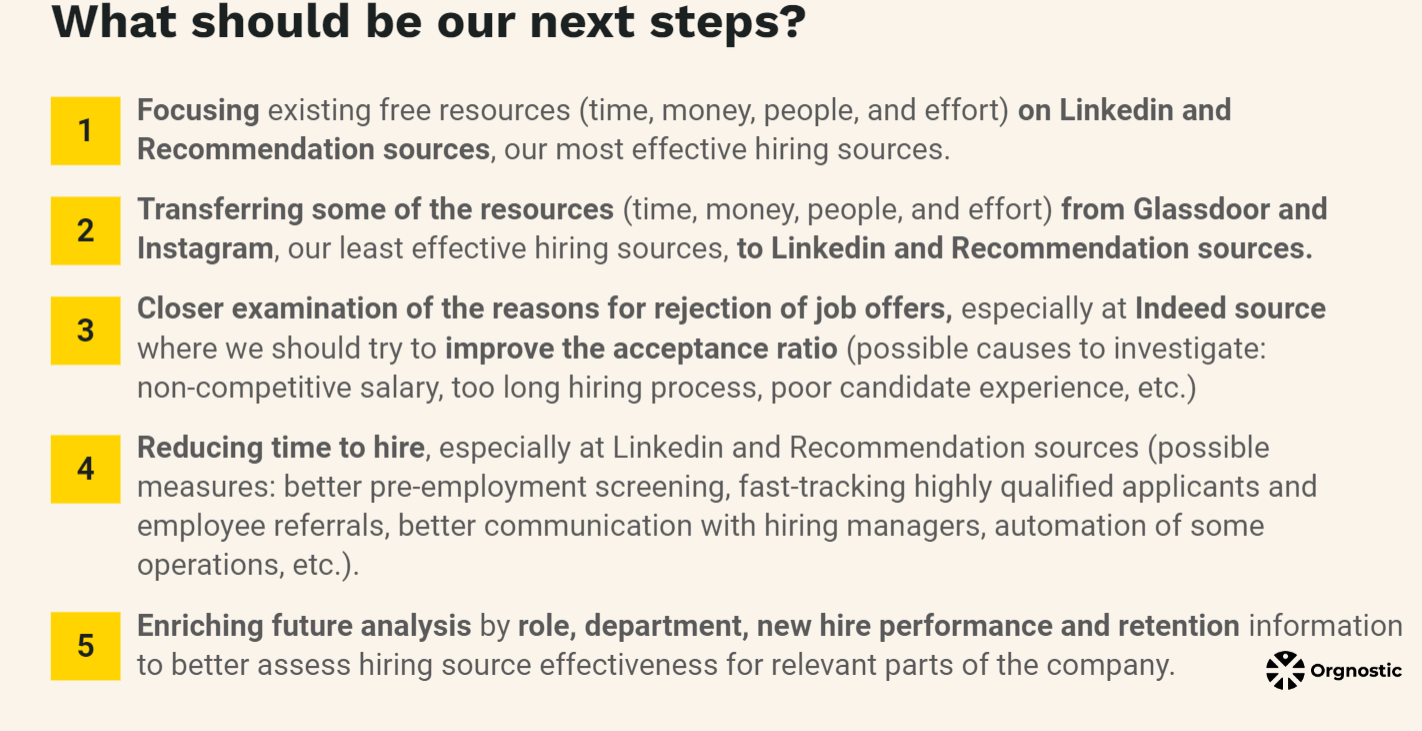
Ludek offered the clearest and most specific next steps based on his analysis:
At last — the winners!
We loved all the entries and deciding on the winners was a tough call — still we had to decide on the solutions that stood out, whether in the angle they used to solve the challenge, a new piece of insight, or creativity and storytelling they brought to the table.
Here is the criteria we used:
- Storytelling structure
- Problem statement definition
- Business-Finance connection
- Clarity of analysis
- Creativity in data observation
- Going beyond
And now — the winners of the first Summer People Analytics Challenge:
🥇1st place — Ludek Stehlik (Planning for High Growth)
Ludek went above and beyond in tackling the high growth challenge, working around the constraints of a dummy data set, enriching them with realistic assumptions, and doubling down on storytelling to show value of data-driven HR strategy in a pithy, on-point language. Congrats, Ludek! 👏
🥈2nd place — Stephen Hickey (Tackling High Attrition)
Stephen did a wonderful job on solving the high attrition challenge. The flow and the clarity of his analysis was top notch and his storytelling is also on point. Plus, he was the first one to use experience loss as an important storytelling element. Kudos, Stephen! 👏
🥉3rd place — Nikolina Jankovic (Tackling High Attrition)
Our last laureate is Nikolina — who was unique in her analysis of experience loss and its impact on the organization and bringing new hires up to speed. Well done, Nikolina! 👏
🌟Special mention — Aulia Raubien (Tackling High Attrition)
Special kudos goes to Aulia, for digging deep in his analysis of high attrition rates and taking a peculiar angle of cross-departmental analysis of turnover. Great work, Aulia!
- 1st place — ticket to HR Technology Conference in Las Vegas
- 2nd and 3rd place — ticket to HRtechX Copenhagen
And that’s a wrap — but only for a while!
Due to popular demand, we’ll be doing more challenges in the future, so stay tuned!
Want to be the first to hear when it’s live? Follow us on LinkedIn, or join our people analytics Slack community — People Analytics Lounge.