Note from the editor: This article has been updated to include all the insights available on the Orgnostic platform.
Automated HR reports are great, but timely reports about trends that require attention are even better. Learn how Orgnostic Insights give you just that.
As a People Ops person without a people analytics platform up and running, you are often conducting analysis by hand. That tiresome process often includes gathering, checking the quality, and crunching your data. This process requires technical skills, domain knowledge, and most importantly — a lot of time.
People Ops teams are usually spread too thin when it comes to operational priorities, so it’s difficult to find the time to invest in building up reporting infrastructure and crunching numbers in Excel.
This is why we designed Insights — a new feature to serve you actionable reports just when you need them!
Let’s see how it works.
Why we created Insights
Once you start using Orgnostic’s people analytics platform — you have your data connected and cleaned up, you’ll see the Story section, which provides an overview of your organization’s headcount, talent acquisition, DE&I, talent management rewards, culture, employee wellbeing, team effectiveness, turnover, and leadership metrics.
But how do you do more in-depth, timely, specific analysis?
Our answer to this question is creating Insights — reports we generate only if we notice that there is a trend that needs your attention at a particular moment.
What do we mean when we say Insights?
Orgnostic connects your data from various sources and turns it into insights, metrics and predictive metrics. What is the difference between these three?
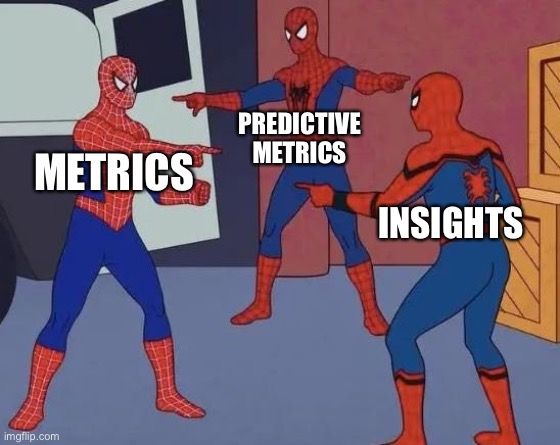
Insights are calculated using a specific segment of your data, and they offer a snapshot of its current state.
Metrics are the data you get either out of the box by connecting your HR apps with the Orgnostic Platform or by running our Diagnostic or Data Filler surveys. For example, Number of Terminations is a metric which offers you an overview of employees exiting the organization.
Predictive metrics are built on top of Story metrics using various statistical and machine learning algorithms to predict issues related to employee turnover, engagement, and burnout. For example, they allow you to predict which employees are at risk of leaving and mitigate the risk.
What differentiates Insights from Survey metrics and Predictive metrics the most are suggested actions — tips on how to act in order to improve or maintain a specific area of interest — for example, the current pay gap in your company.
How do Insights work?
Whenever your data meets a few predefined assumptions, we run a relevant statistical or Machine Learning algorithm which checks whether we can identify an actionable insight.
If a specific insight is detected in your data, the results of the analysis will be shown in Orgnostic.
These results are also accompanied by suggested actions which could be rolled out by an HR team. Suggestions are extracted from research and results in behavioral economics, psychology, and public policies.
However, if an actionable insight is not detected in your data, you won’t be bothered with unnecessary notifications!
Let’s look at all the insights you get with Orgnostic.
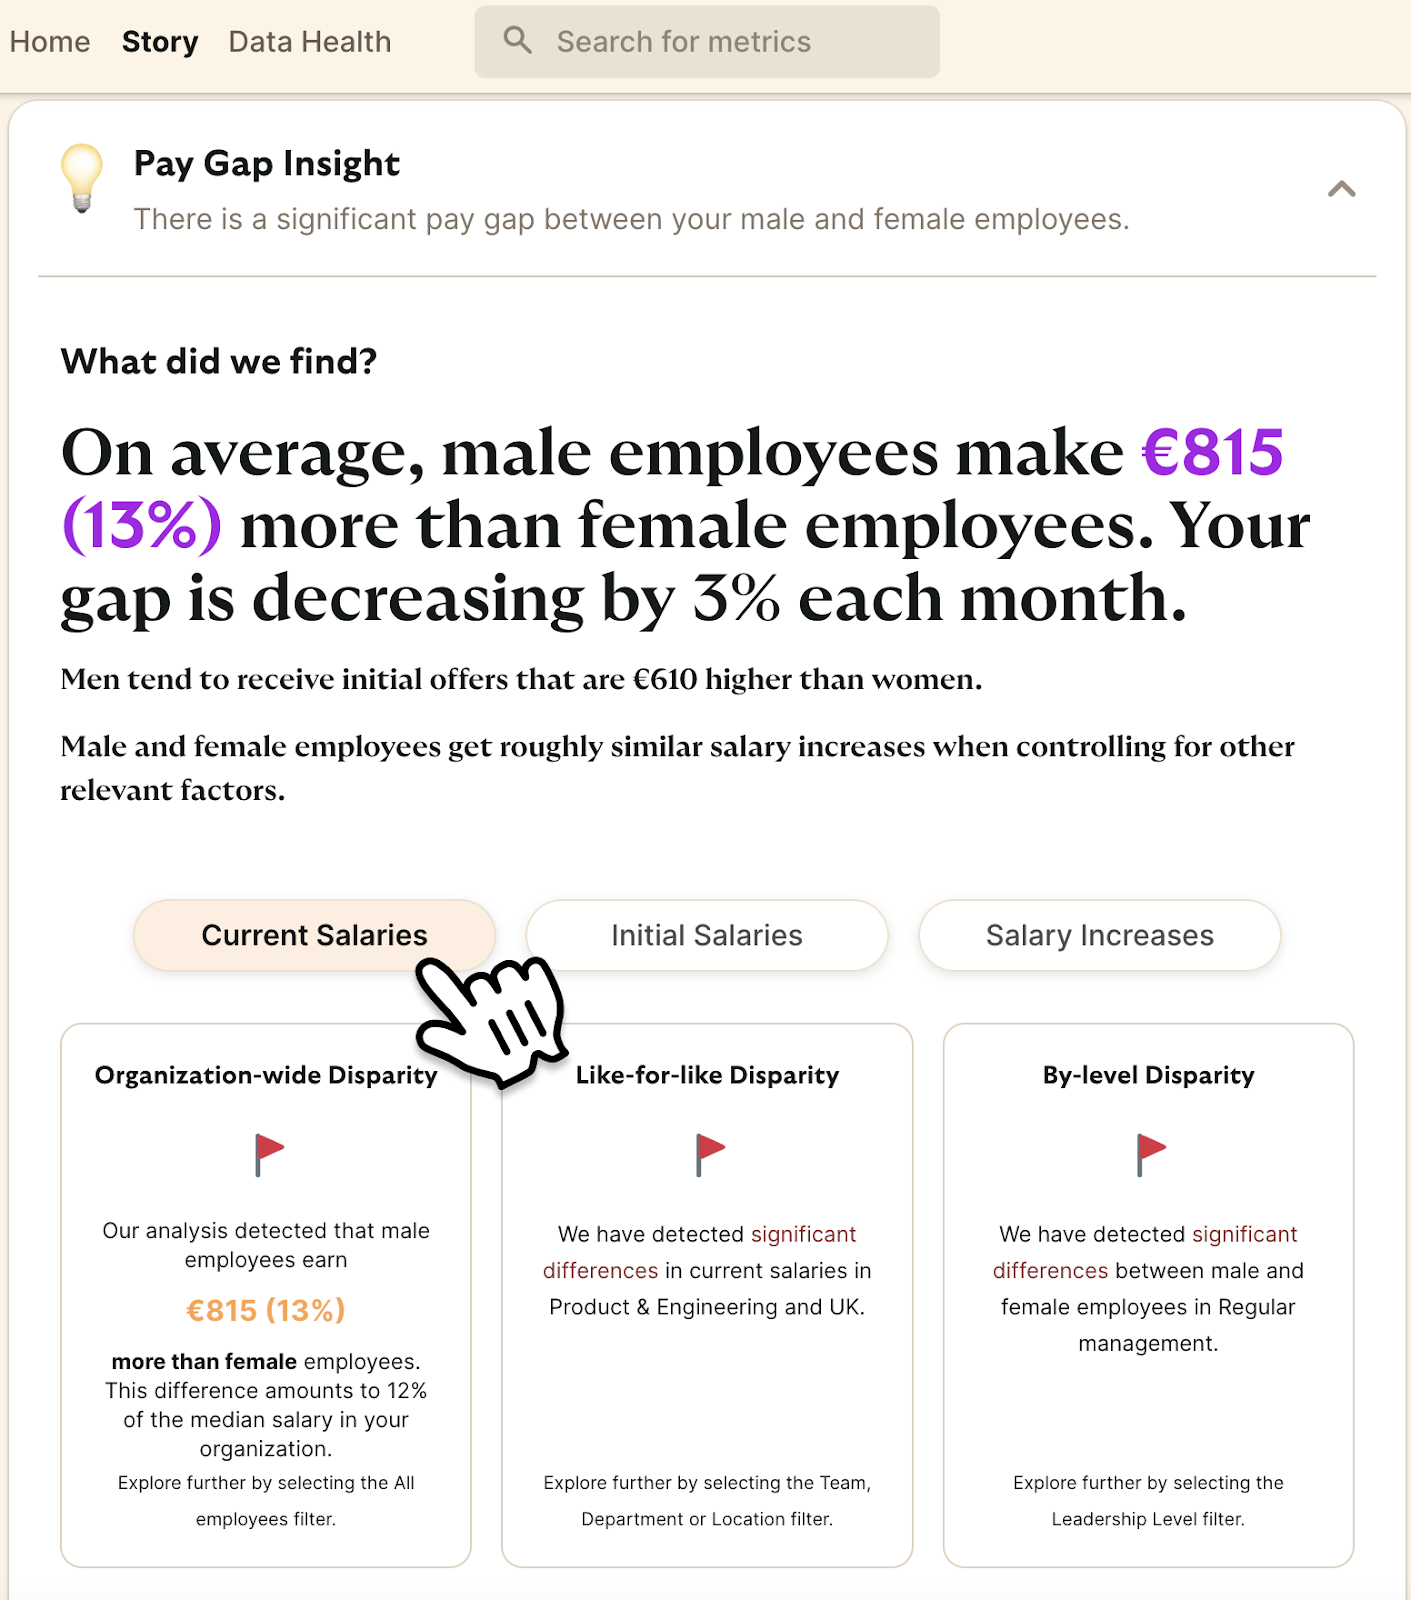
Pay Gap Insight
With the Pay Gap Insight, you can identify and close pay gaps before they take a toll on your employee’s well-being and engagement.
With the Pay Gap Insight, you get information on:
- How starting salaries or salary increases differ between men and women
- What you can do to address these differences
We use a model to analyze pay differences between men and women, factoring in variables like tenure, age, and leaves, and identify teams or locations with persistent significant differences after considering these variables.
Furthermore, we assess compensation equity across all teams for leadership roles, providing valuable insights into your company’s current state and highlighting areas of concern within specific teams, departments, or potential gender pay disparities in leadership roles.
👉🏼 For a deeper dive into this topic, learn more about the New and Improved Pay Gap Insight.
Turnover Insight
To decrease unwanted employee turnover, it’s crucial to first identify the underlying factors within your organization that sparked turnover in the first place.
The Turnover Insight helps you pinpoint these factors, enabling you to implement interventions that make a difference and keep your talent.
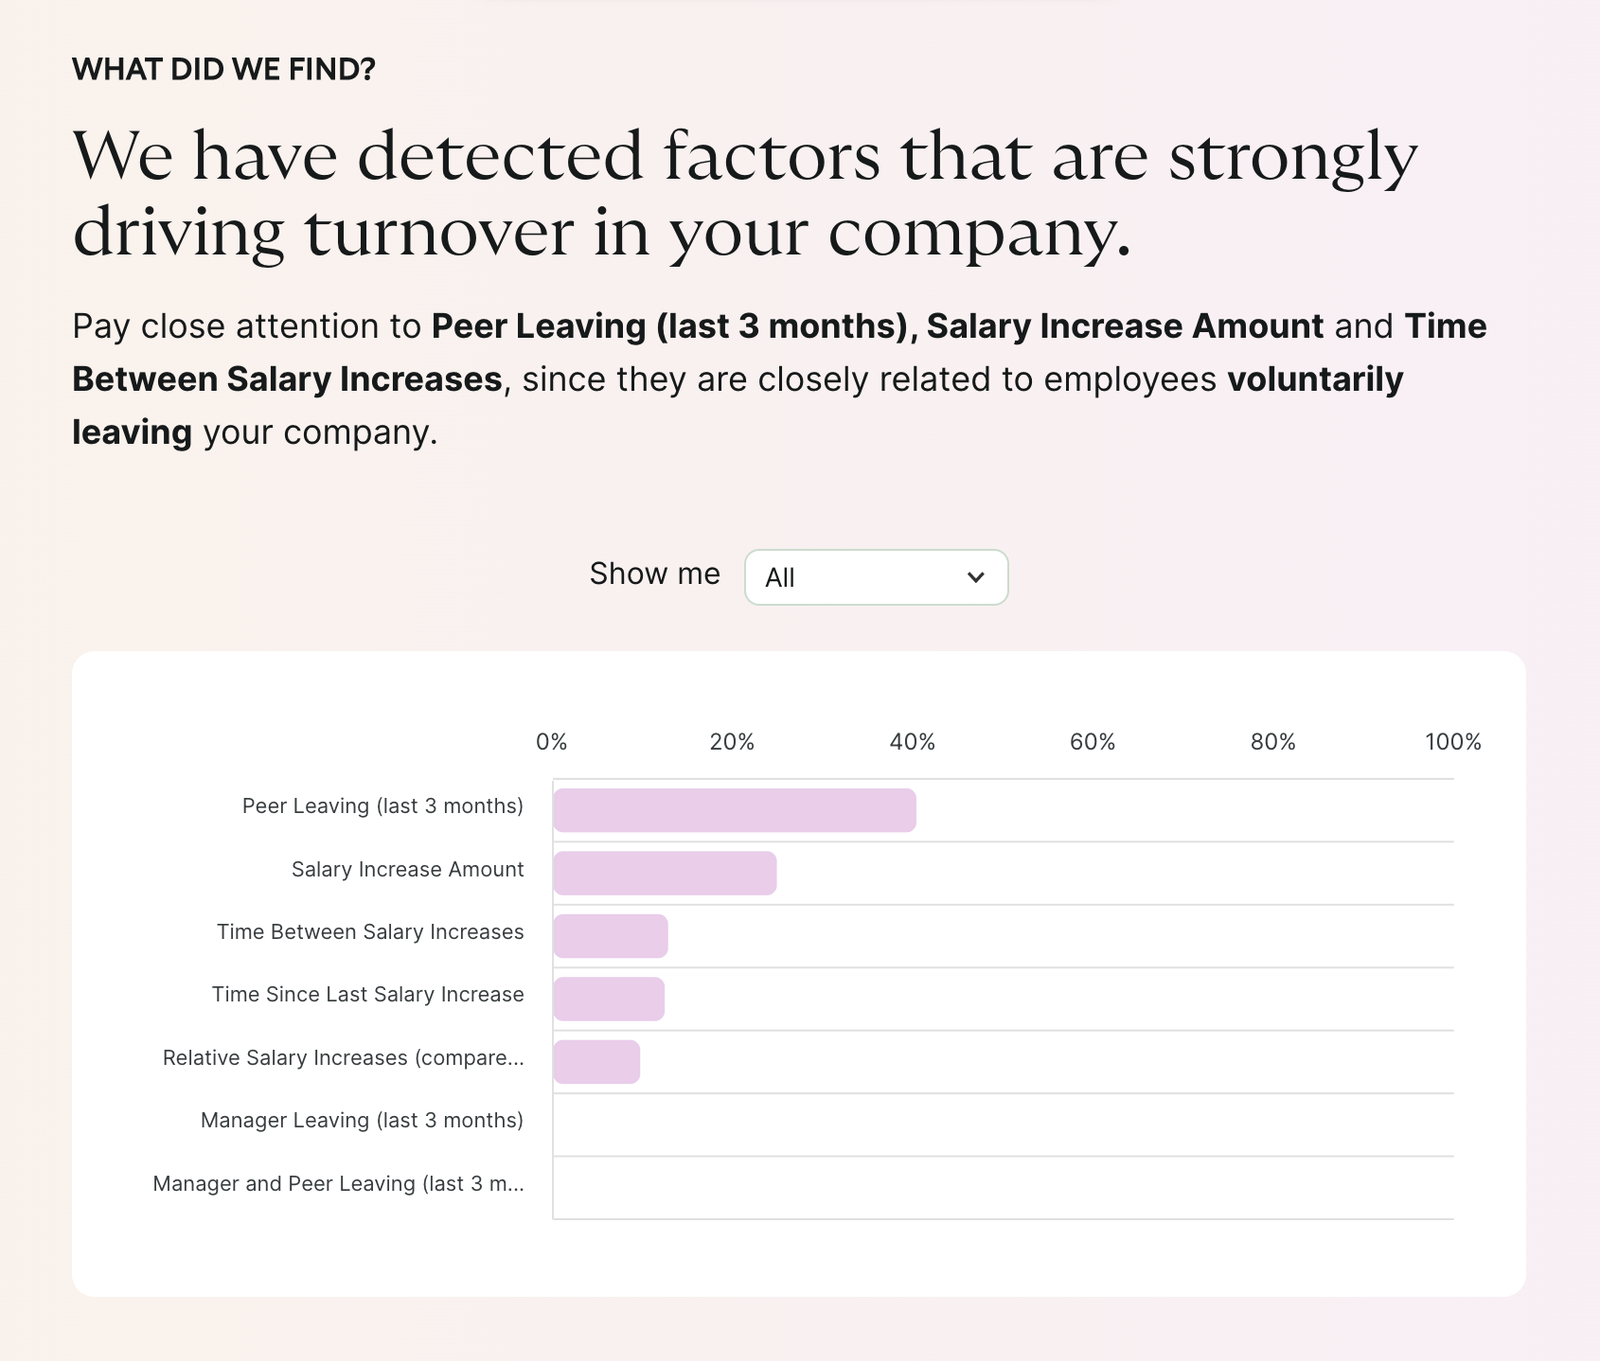
The Turnover Insight focuses on factors related to salary practices in your organization, as well as factors related to chained turnover events.
For a quick walkthrough of key pieces of information you get with the Turnover Insight, hear from Mirta Stantic, our Director of Product, Insights:
👉🏼 For a deeper dive into this topic, learn more about the Turnover Insight.
Hiring Bottleneck Insight
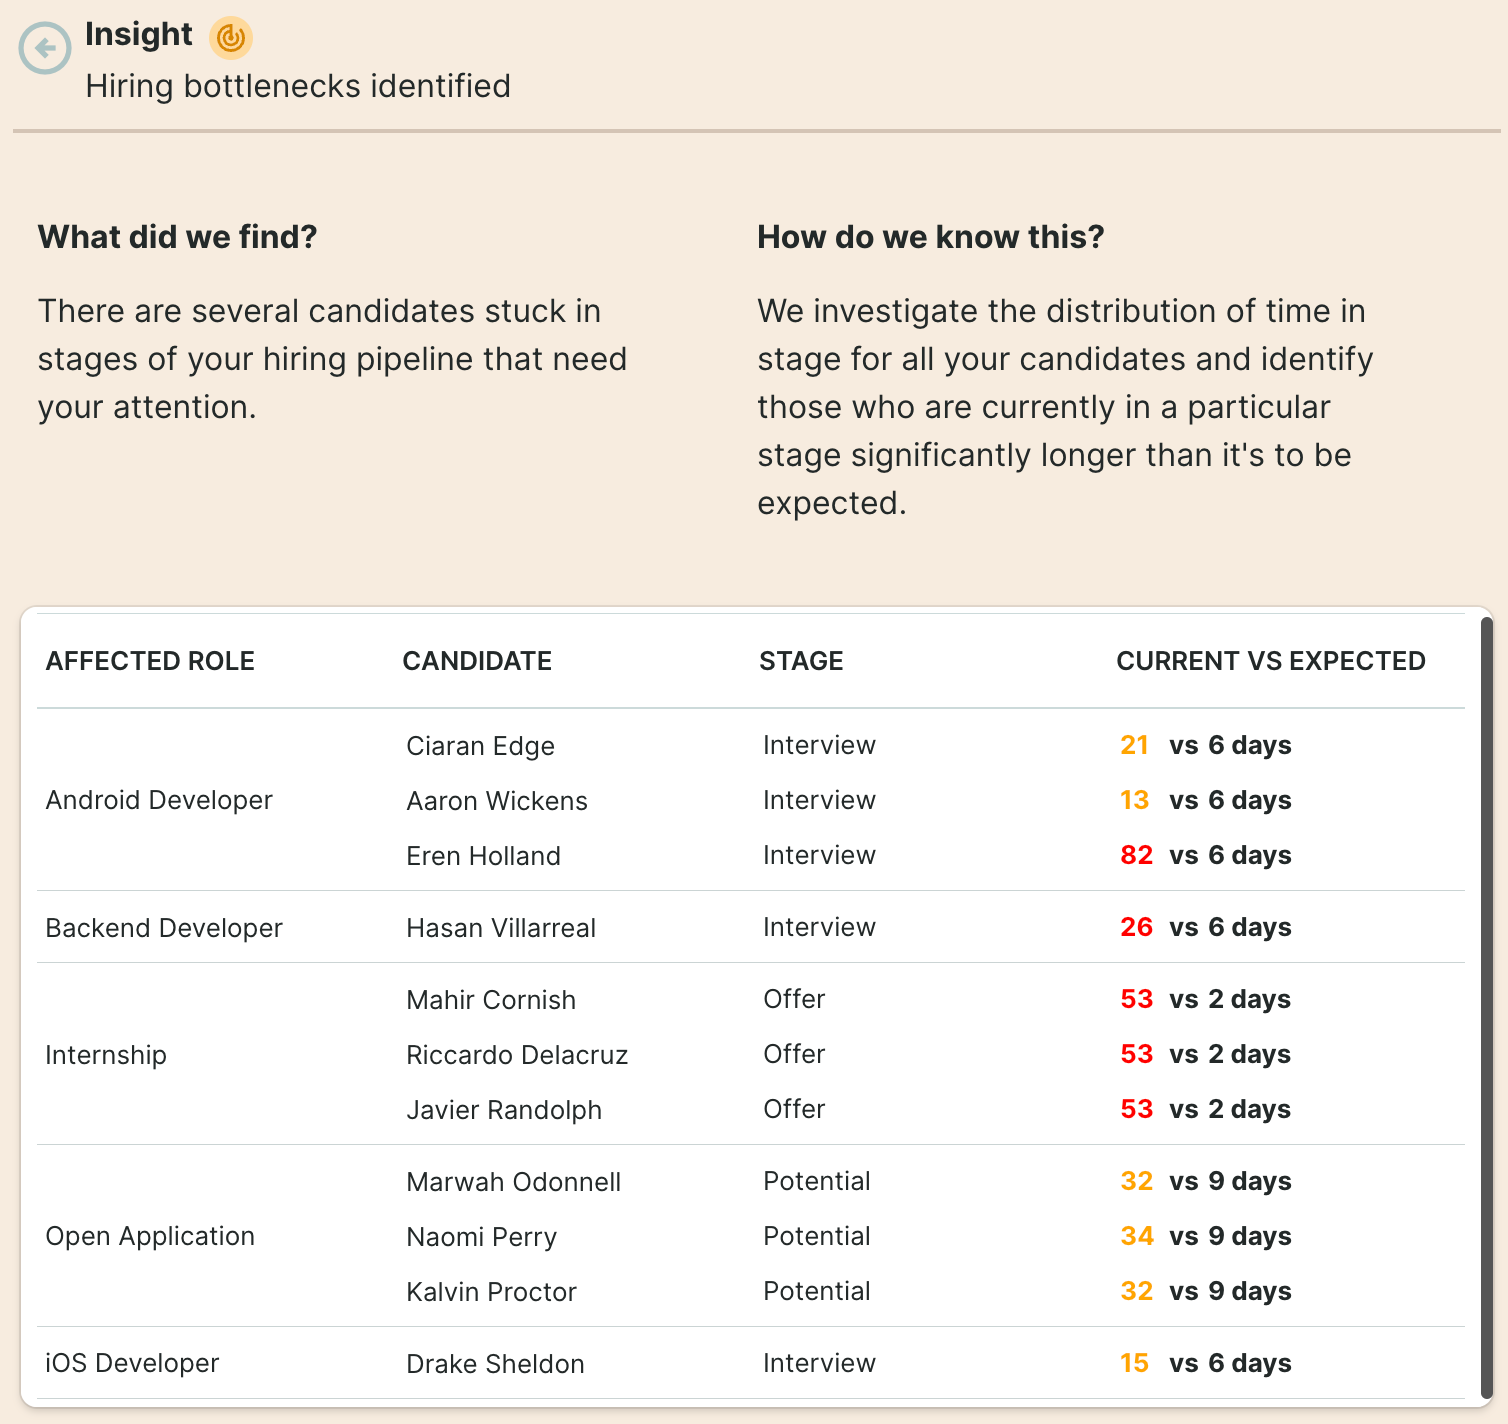
Prolonged inactivity in the hiring process can prompt applicants to drop out of it, applying for or accepting another offer.
With the Hiring Bottleneck Insight, you can proactively address this situation by accessing tailored information about candidates at risk of experiencing delays in the hiring process.
With this insight, you get a different view of the candidates and the stage they are currently in, along with the information on how long they have already spent in that stage compared to the expected value.
👉🏼 For a deeper dive into this topic, learn more about Hiring Bottleneck Insight.
Candidate Drop-Off Insight
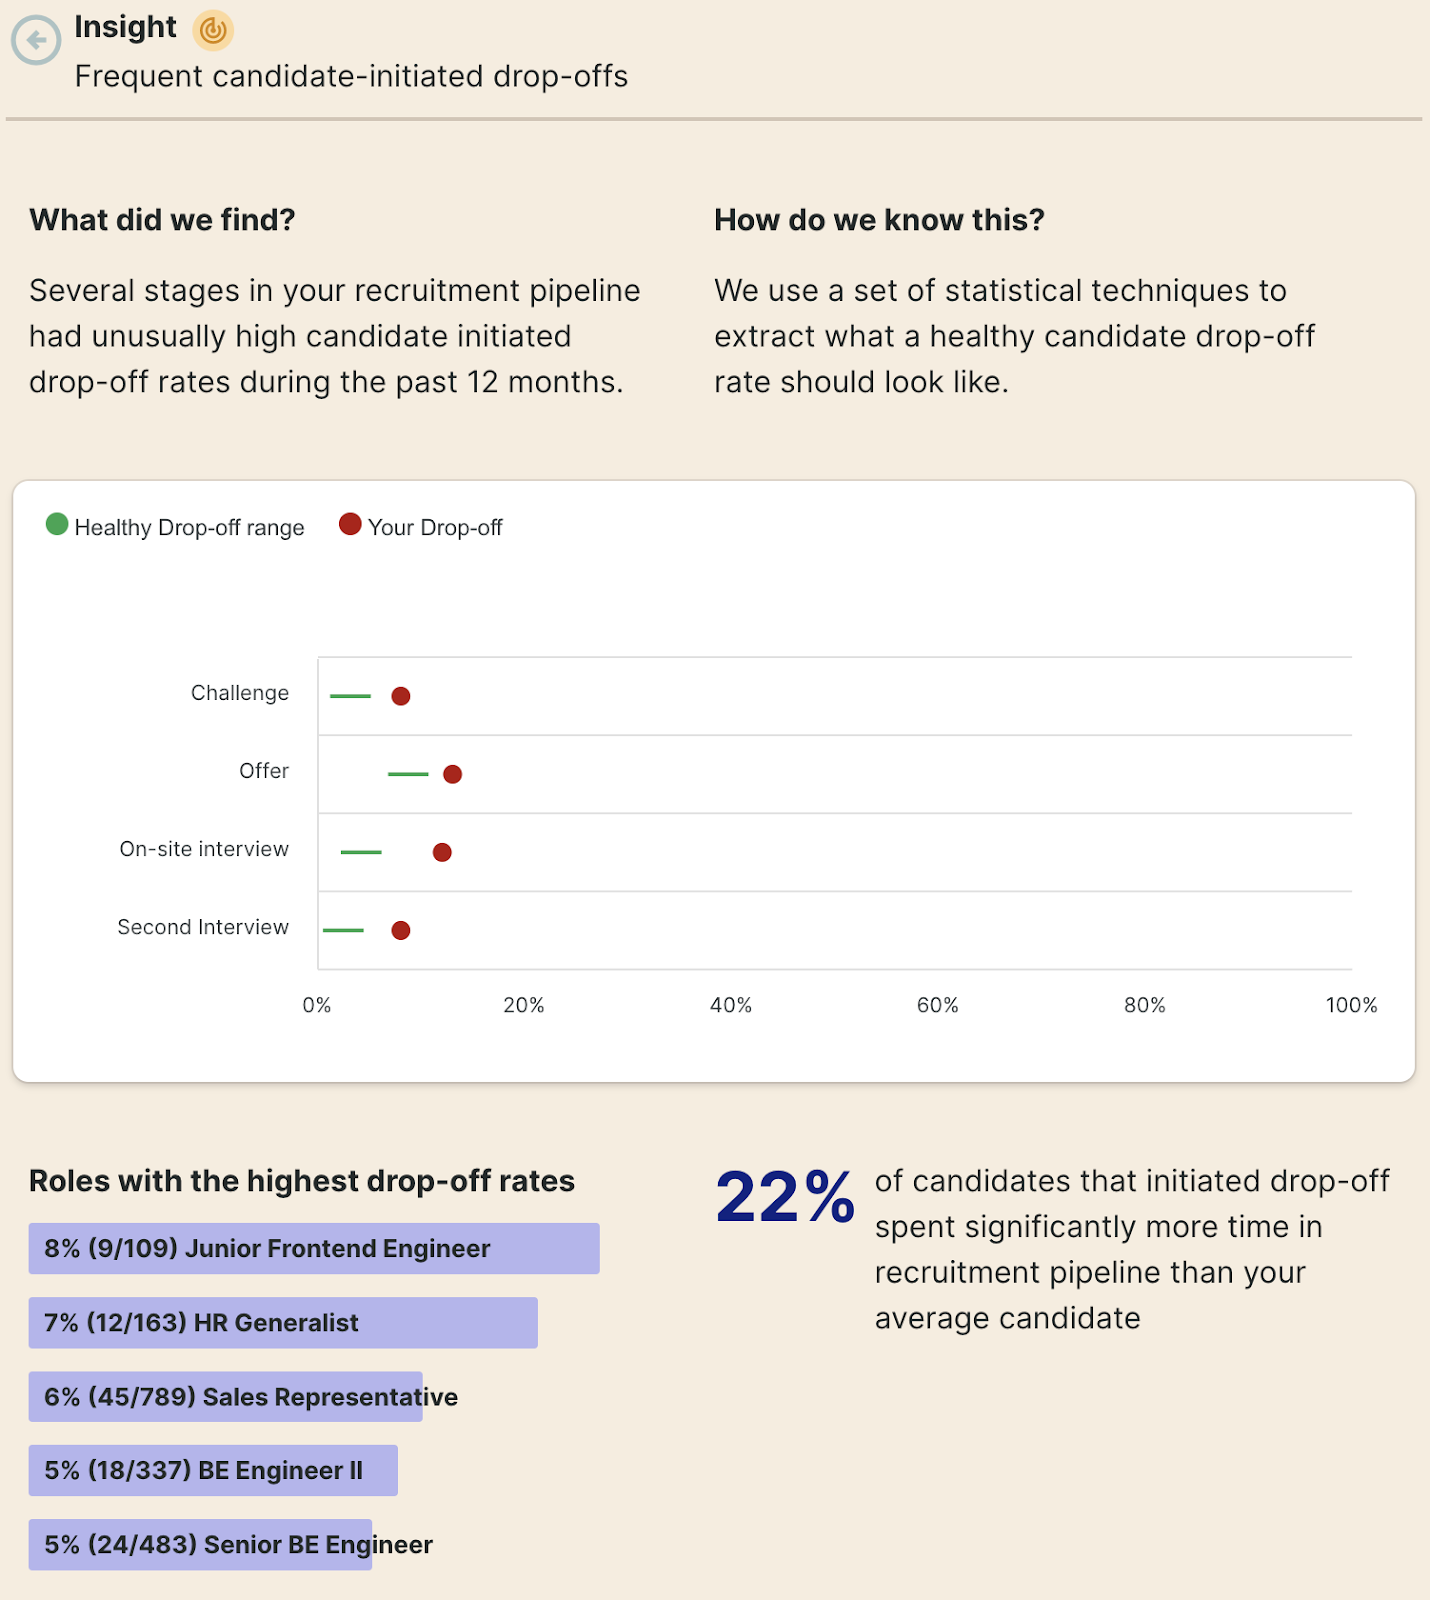
When candidates are left without attention in the hiring process for an extended period, they often choose to withdraw their application, decline their offer, or accept another offer elsewhere. This results in significant inefficiencies for the hiring team and adds extra pressure to initiate the recruitment process anew.
Through the Candidate Drop-Off Insight, you gain a timely perspective on the impediments within your hiring process. This enables you to address them promptly, ensuring that the ideal candidates remain in the pipeline and, ideally, become valuable team members.
You get an insight into stages with an unusually high number of candidates withdrawing from the process. You also get info about what a healthy drop-off rate should look like for your organization.
👉🏼 For a deeper dive into this topic, learn more about the Candidate Drop-Off Insight.
Unplanned Leaves Insight
Unplanned leaves can stem from various reasons such as illness, medical appointments, jury duty, weddings, or employee burnout and can significantly affect project delivery by disrupting timelines and project scopes.
To address this, it’s crucial to gain insights into which business units experience disproportionately high levels of unplanned leaves compared to the company average and to anticipate future unplanned leaves.
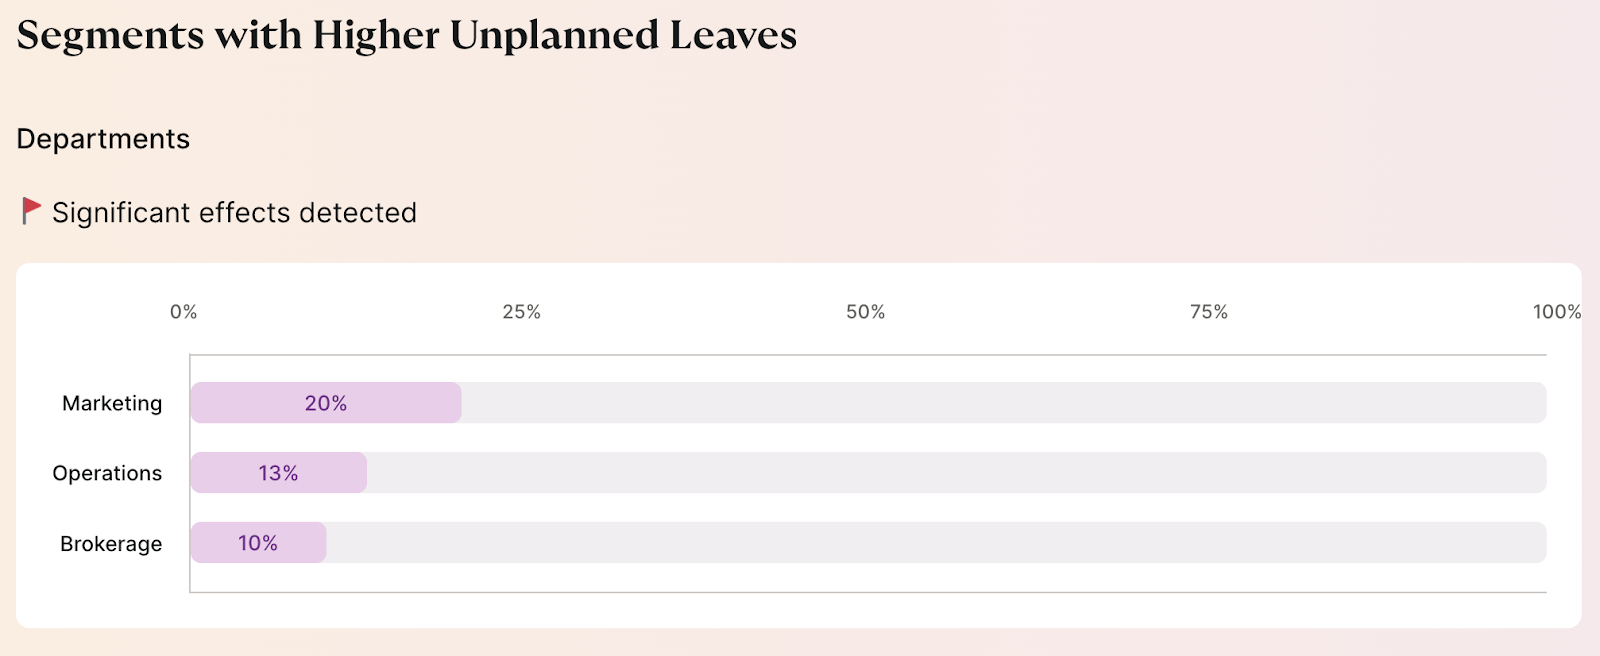
This is where the Unplanned Leaves Insight comes into play, providing valuable patterns and information to help you better understand and manage these unexpected absences.
Our Unplanned Leaves Insight conducts an analysis of your business units, identifying those with noticeably higher rates of unplanned absences compared to the company’s overall average.
👉🏼 For a deeper dive into this topic, learn more about Unplanned Leaves Insight.
Employee Net Promoter Score Insight
The ability to determine the factors associated with employee loyalty is a crucial stride in creating a workplace that enhances employee well-being and fosters their engagement.
The Employee Net Promoter Score (eNPS)—frequently seen as the primary loyalty metric for a company, is a straightforward rating generated from one question: ” “How likely are you to recommend your employer to others as a place of work?”.
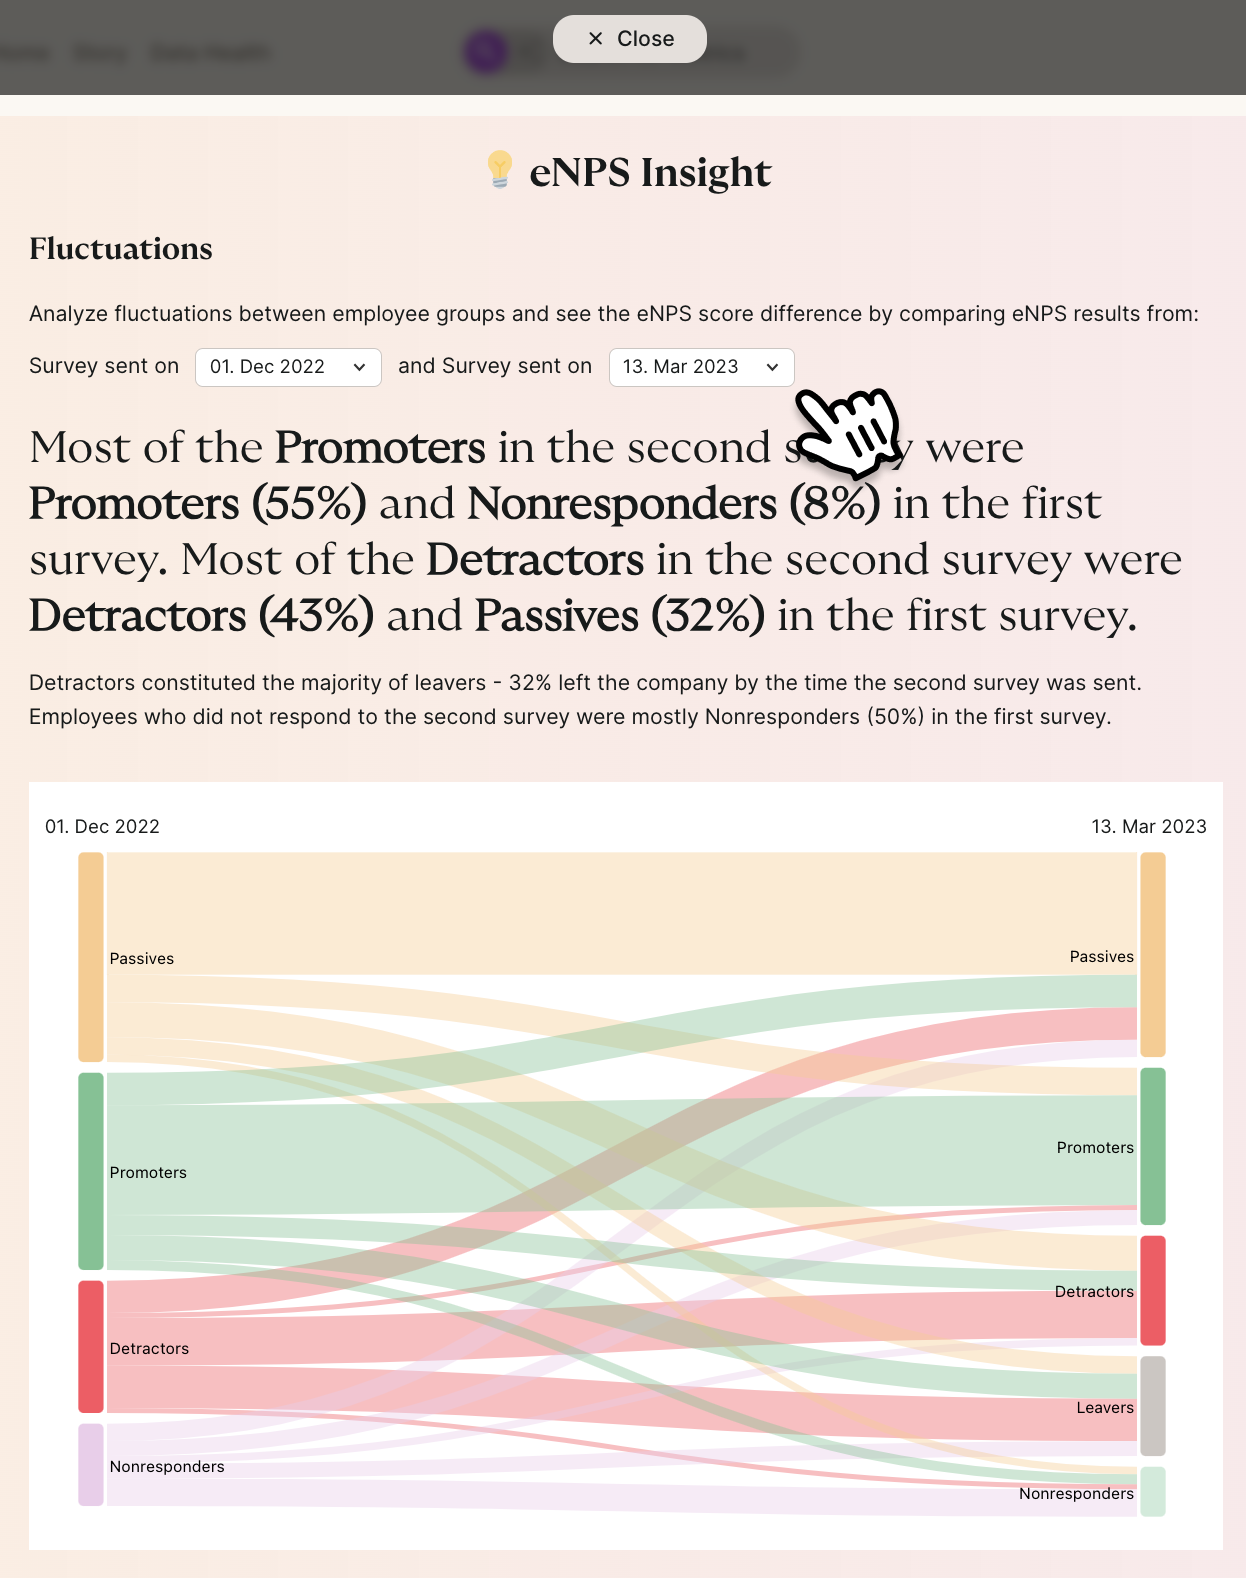
Our insight is designed to address this very issue by pinpointing the factors that influence the employee net promoter score and the changes in this score between survey rounds.
Monitoring the evolving composition of eNPS groups is crucial for understanding whether employee concerns are effectively acknowledged and resolved. Orgnostic’s eNPS insight provides a holistic approach to assessing the dynamic shifts within these groups over time.
For a deeper dive into this topic, learn more from 👉🏼eNPS insight blog or watch our walkthrough on how to use the eNPS Insight.
Want to get served insights you can act on? See how you can cut the time to impact with our suite of insights and detect adverse trends before they take a toll on your workforce. Book a free personalized ideation session →