Using data to inform HR strategies is becoming a must. Learn more about recent people management changes and crucial HR areas to track in the remote setup.
“Hindsight is 20/20” must have been a great joke by a time traveler. Obviously, the employee experience has profoundly changed since March two years ago.
In the last two years, the focus of our team at Orgnostic has been to help companies grow, introduce people analytics practices, and start making data-informed decisions about their workforce. In this article, I will share some of the learnings we got along the way.
This article should help you understand the butterfly effect of recent HR tech ecosystem changes and why now is the best time to start using data for building HR strategies. You will also learn about some of the analyses that you can conduct and some less obvious metrics you need to track to better inform your (post-)COVID strategy.
People management in the COVID era – what has changed?
Some of the changes that we have observed in the last two years, such as a large share of the employees working remotely, are obvious. For this reason, I would like to focus on the changes that may be less apparent, but have largely impacted the HR space.
Changes in people management
The shift to remote settings has affected a lot of managers’ sense of control, which in turn also affects their confidence in their own abilities.
I’ll use a mock chart to illustrate the story:
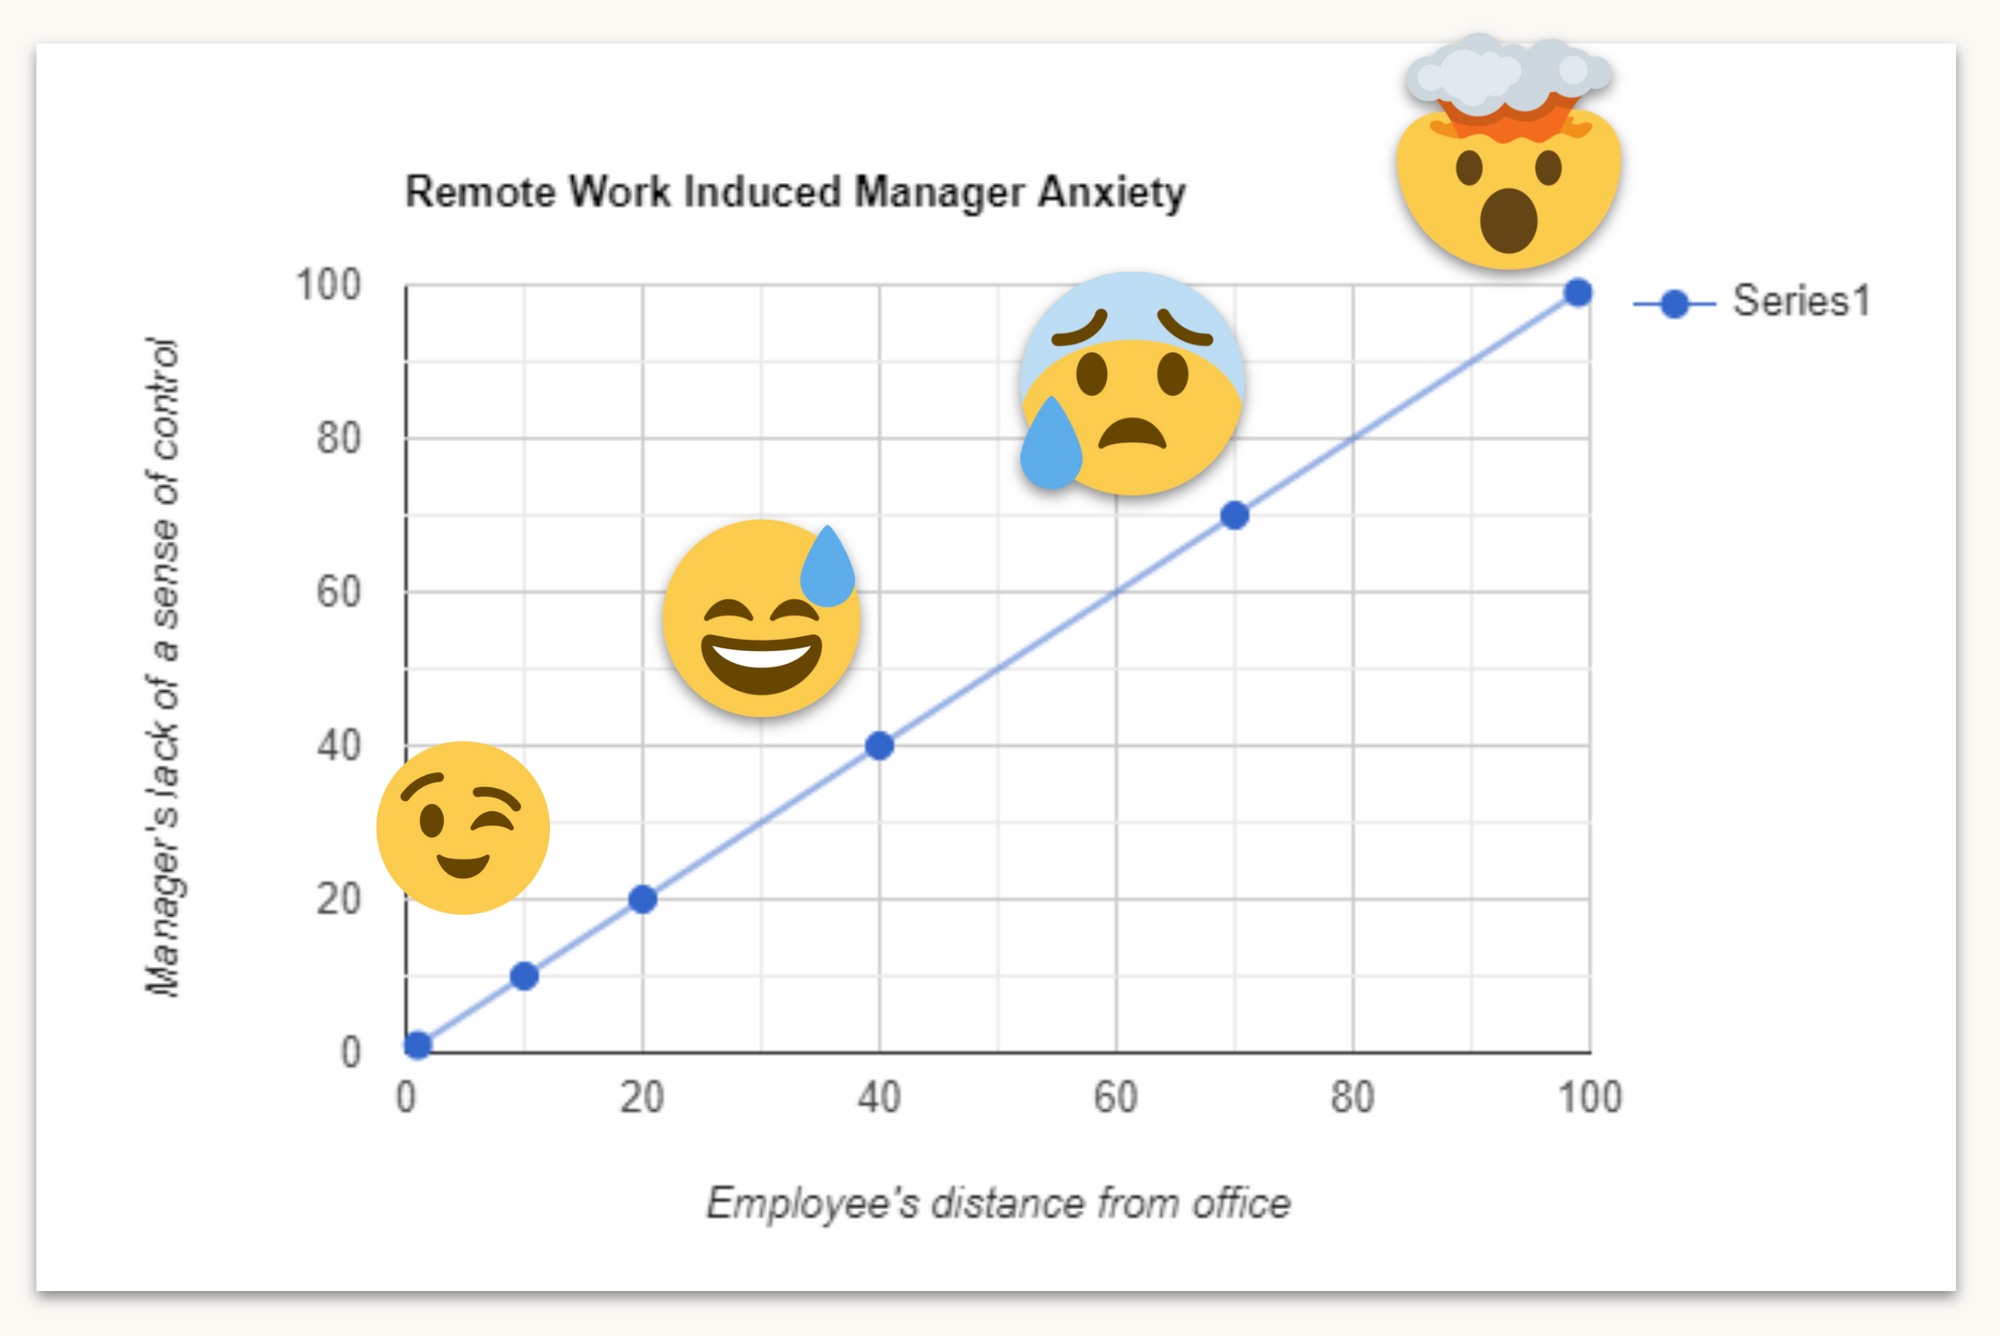
The X axis represents the employees’ distance from the office; zero means that every employee is working from the office, a hundred means that the workforce is fully remote. The Y axis illustrates managers’ perception of losing control. Zero is when managers feel in control over their team (e.g., know what the employees are working on, what is the progress); a hundred is when managers feel they don’t control the team (e.g., feel unsure about what the employees are working on, whether they are working at all; sometimes they may even not know who are the people they should be supervising).
Back in 2019, when most people were working from the office, managers were quite confident that being physically close to their team members they had a better sense of whether their teams were productive or not. But even then, we could see some differences in management of the remote employees, and of those who were working from the office.
We can explain these differences through a phenomenon called proximity bias. Organizational psychologists use this term to describe a tendency to perceive someone to be a better employee due to the mere fact of having this person physically close (e.g., in the same office). Even before the pandemic, the people that were much closer to the headquarters were likely to have more opportunities for growth, higher chances for a promotion, etc., compared to the colleagues who were working in a subsidiary, or remotely. Out of sight, out of mind, as the proverb goes.
But when the pandemic started, suddenly everyone was working from home. Looking again at the chart, organizations moved on the X axis from zero to a hundred overnight. We can expect that with proximity bias being off the table, many managers felt that they lost control of employees, and started thinking about the best ways to keep their cool and to get back in the driver’s seat.
Technological changes
To a certain extent, the post-COVID reality has been a wakeup call – now the managers don’t see people around in the office, they feel compelled to do something to regain control. The shift to the remote setup has caused a lot of concerns about employee retention, experience and productivity, although, in reality, the elements of team effectiveness in the remote setting are not much different from those in the co-located teams.
Even before 2020, we already had the technology needed to manage teams in a remote setup. However, the pandemic pressure has triggered a massive change in the HR technology space, which is hugely impacting the HR practice itself.
According to recent studies (PwC, HR technology Survey 2020), around 4% of the surveyed companies (which corresponds to approximately 600 companies), reported an average of 30% increase in their HR tech budgets in 2020 – quite a significant bump to happen in a single year.
We have also noticed a change of focus when it comes to purchasing HR tech solutions. While before the pandemic the HR tech trends were all about centralizing data and using all-in-one solutions, like SAP or Workday, now we see companies frantically searching for the best-in-class tools to manage a particular HR process. As a consequence, more and more organizations use several vendors to cover different processes that they manage.
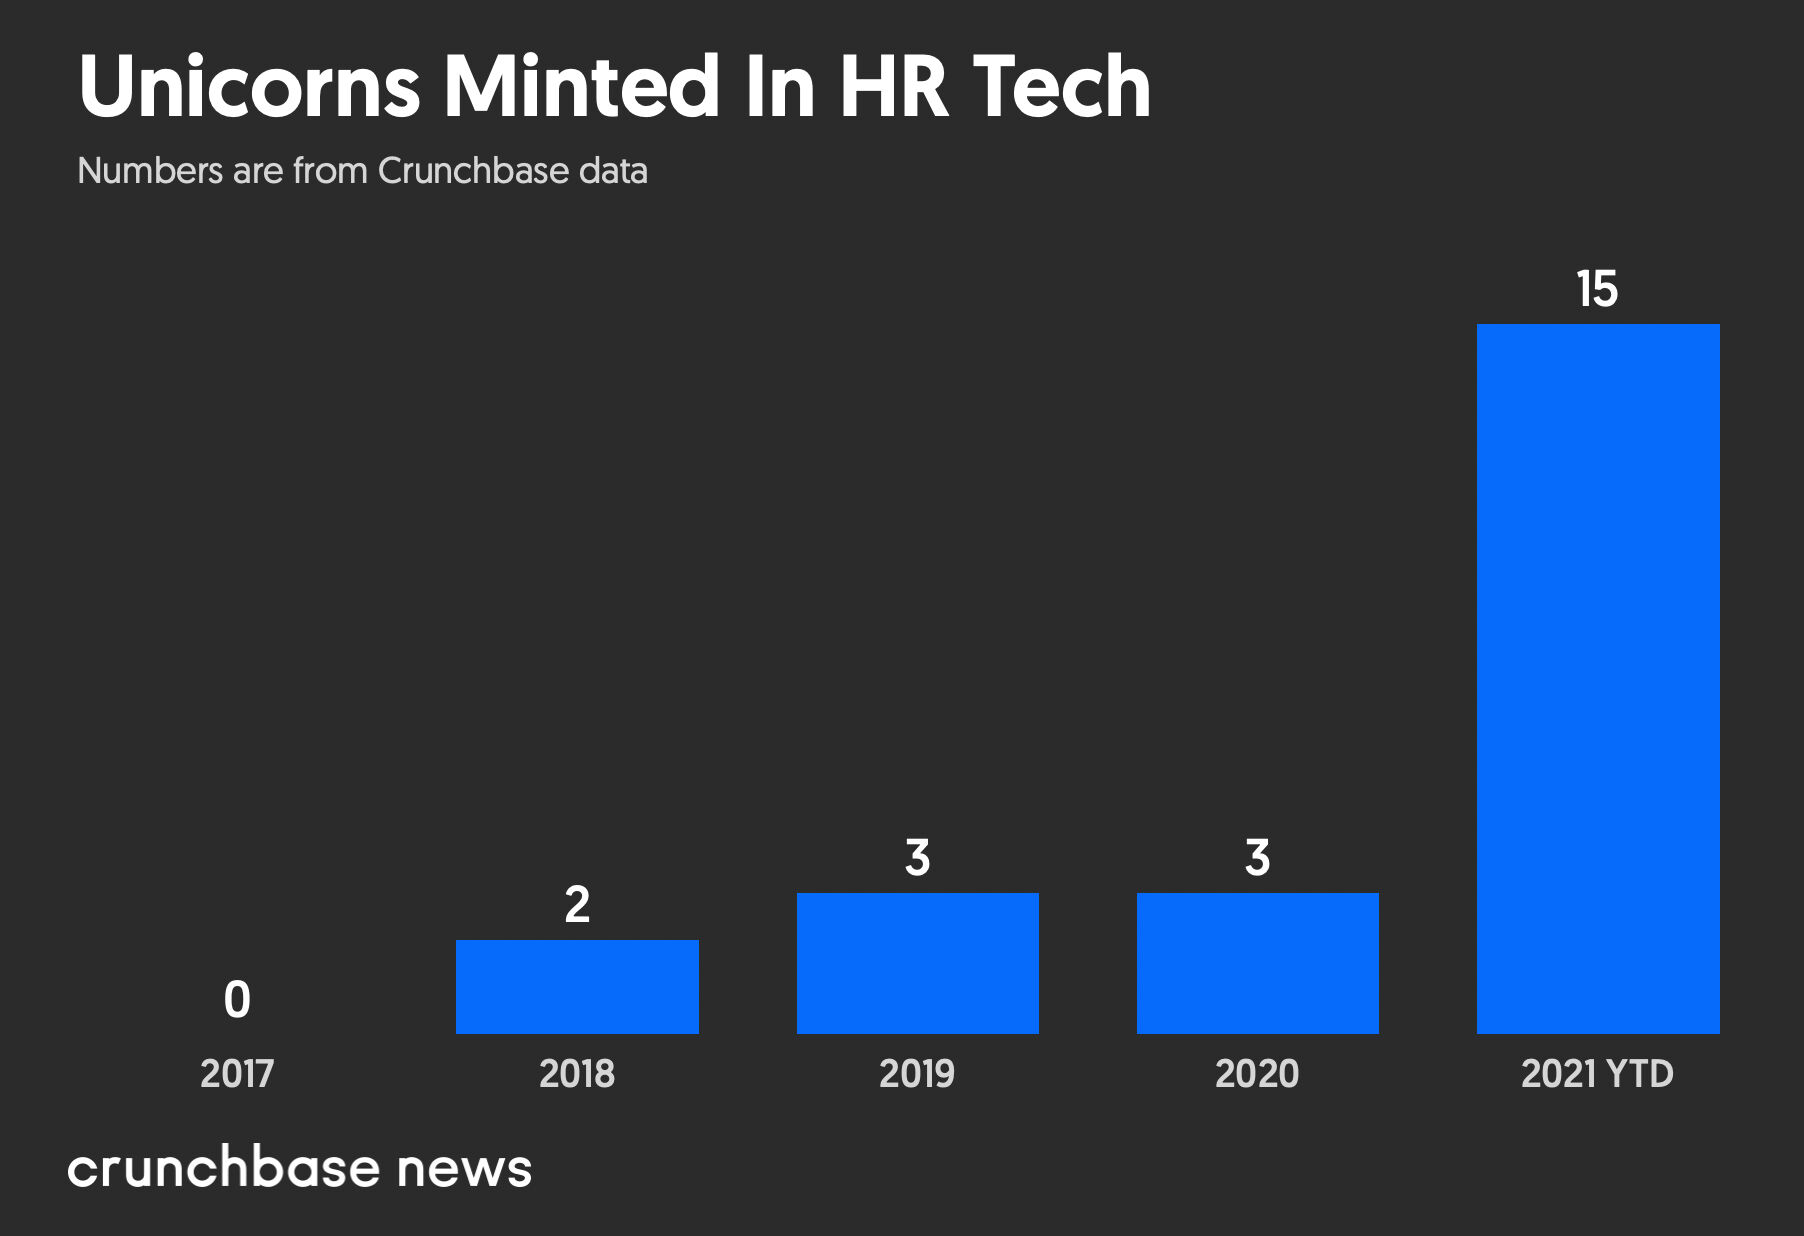
This shift has fueled the growth of HR tech unicorns. In all of history, there were ten companies in the HR tech space that achieved a $1 billion valuation; and in only one year we have seen fifteen HR tech companies getting to that status. All of this money flowing into HR technology is actually an investment in strengthening the position of HR departments within companies.
Investors and markets are betting that HR tech is a great new space for investment, and this sudden interest and wave of money that is poured into HR technology is strengthening the position of HR departments and CHROs within companies.
For this reason, now is the best time ever to push for HR budgets to introduce and increase the needed support for the management area that was traditionally quite neglected.
What does the fast growth of HR technology have to do with a data-informed employee experience?
The usage of HR tools is essential when it comes to collecting and storing human capital data. First, these tools package data into structures that are much easier to maintain and manage than the good old Excel. Moreover, replacing Excel with management tools focused on specific HR processes increases the quantity and quality of the stored data.
Given that during the COVID pandemic the interactions between employees and face-to-face communication have decreased, this data is opening up new possibilities of exploring the employee experience and understanding the organization in a more tangible way.
It allows for capturing valuable information about every HR area in the organization:
- talent acquisition and candidate experience through applicant tracking systems,
- payroll rewards and organizational changes through the HRIS,
- the promotion and performance feedback through performance management tools,
- learning experience through learning management softwares,
- employee sentiment through employee engagement and service softwares.
I believe that the reason why HR has traditionally been lacking this data orientation, as opposed to functions such as finance or marketing, is not because of the lack of the talent or competencies in these teams, but rather due to the limited degree of HR process digitization and insufficient data.
Currently, with an increasing number of available HR tools, even small companies have a chance to store good amounts of relevant employee data and use it to inform their decisions and people management strategies.
Tracking HR processes – metrics that matter
That said, let’s explore some of the analyses you can conduct in your organization that can feed into your (post-)COVID strategy.
I will focus on the recruitment and onboarding experience, interdepartmental collaboration, environmental support, and retention analysis as these four areas have been particularly in focus for many organizations in the past two years.
Recruitment & onboarding
Let’s start with the analysis of your organization’s recruitment and onboarding experience. With an intense growth and changing volumes that are happening in many companies around the globe, talent acquisition has been a hot topic.
Applicant Tracking Systems and other HR tools organizations use for tracking recruitment processes usually don’t permit detailed analyses, but almost all of them allow to extract and analyze raw data using people analytics platforms.
One technique that I find particularly useful in determining efficiency and consistency of a hiring process is looking at the stage conversion flows across times and stages.
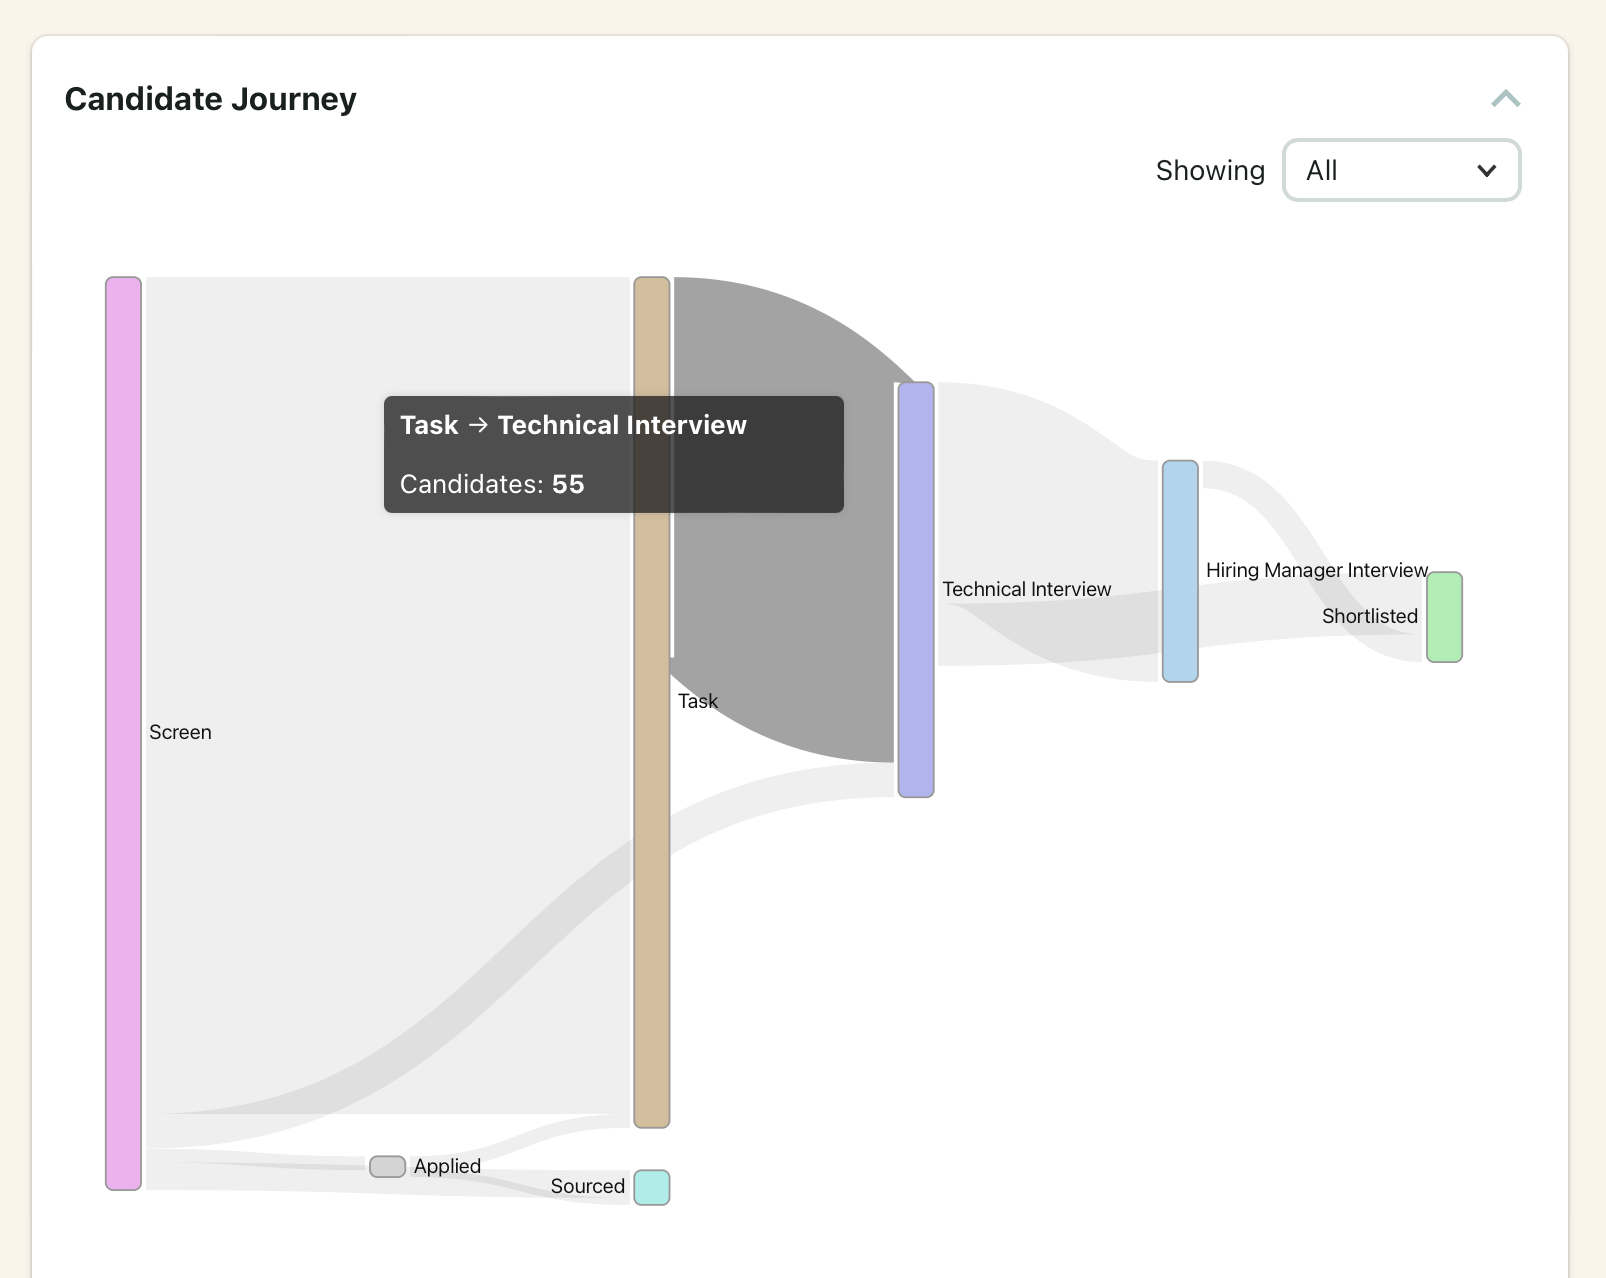
It allows us to check whether people move from one phase of the hiring process to another following some structured path or rather a random pattern.
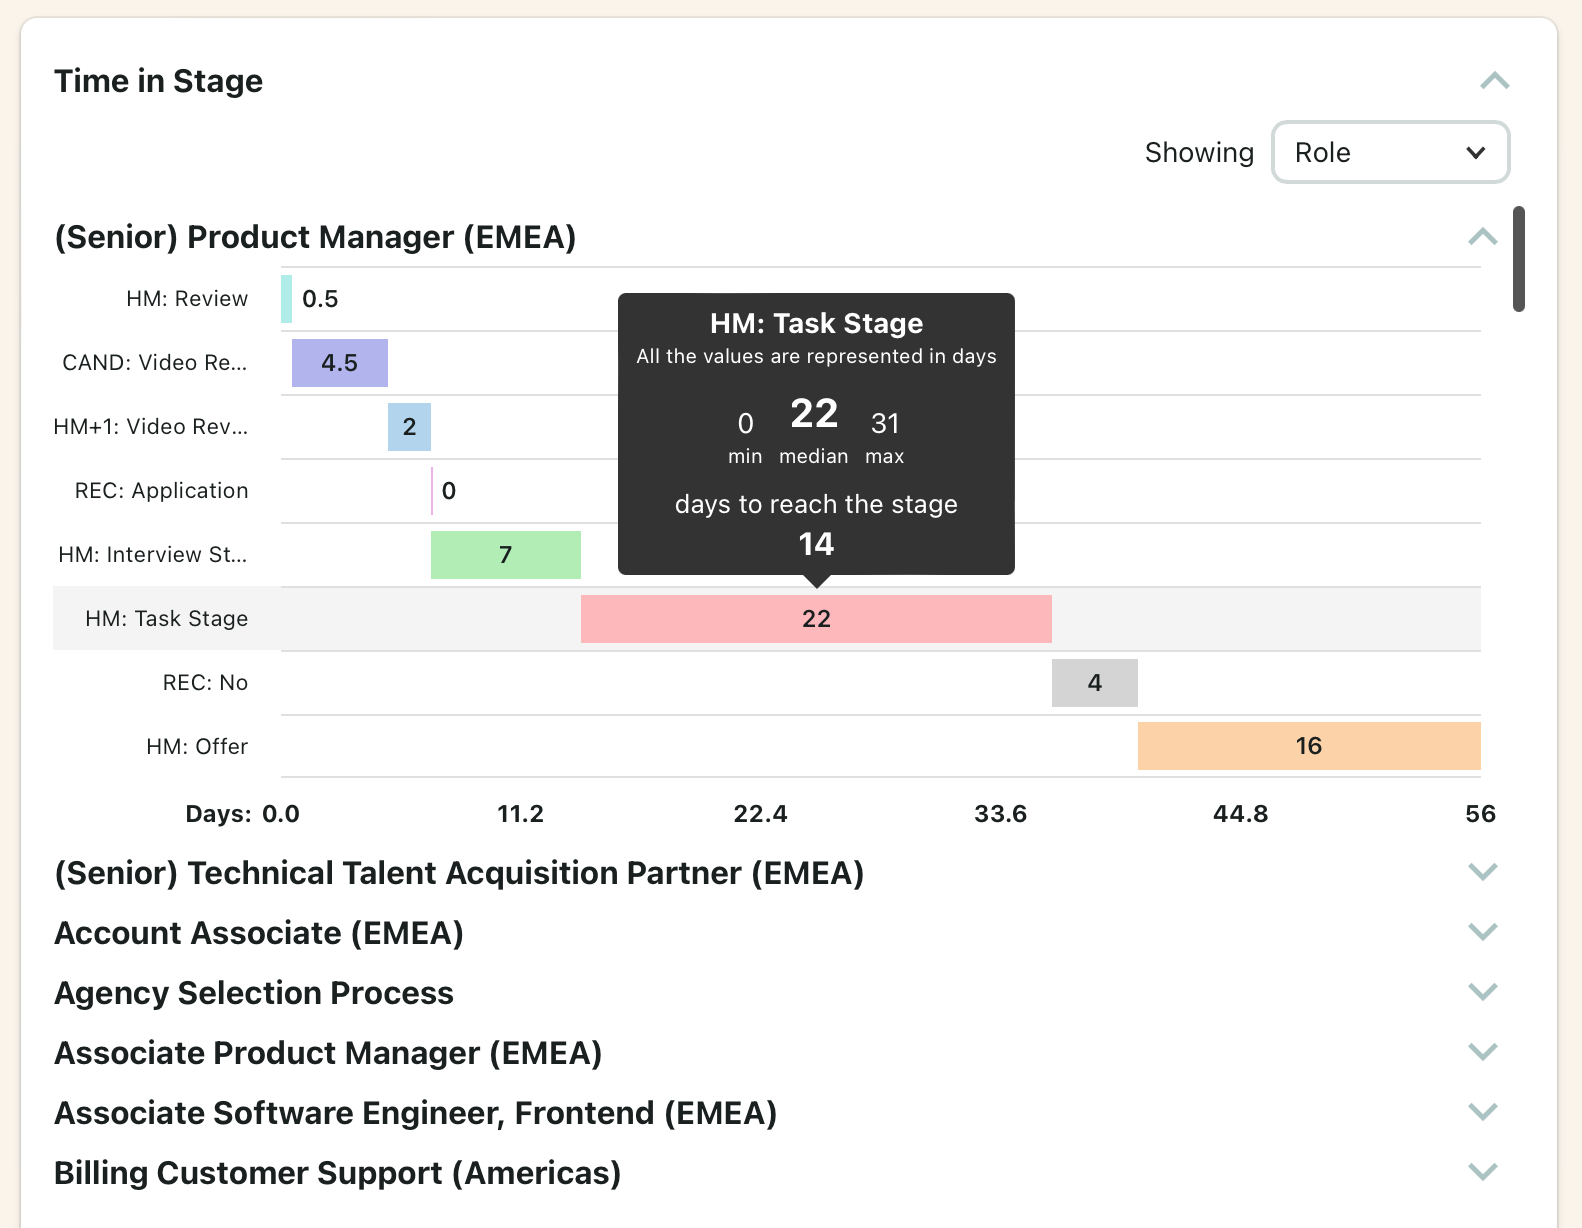
We can also explore how much time candidates spend in each stage and what are the differences between the candidates’ experience in particular stages of the hiring process. The more consistency within the business unit, the higher likelihood that the experience of your potential employees is positive, and that the candidates will become ambassadors of your employer brand.
Once you have an overview of the recruitment funnel setup and you’re tracking the consistency of your process, you can link this information to your onboarding data. A good practice here is to send onboarding surveys right after the new employees start working.
Then, through the review process within the first 90 days, you can collect employees’ and their managers’ feedback about their onboarding experience and the newcomer-company fit.
Another measurement that you can track in these 90 days is the quality of hire. It’s one of the holy grail metrics when it comes to recruitment. It links the hiring process with its actual results, something that oftentimes is missing in recruiters’ minds.
In addition to information about whether you have achieved your recruitment targets, this metric can also provide valuable feedback about the correlation between the quality of hire and the efficiency of recruitment sources or of your referrals. It can also show whether there are certain recruiters or hiring managers who have better assessment capabilities.
Interdepartmental collaboration
The rising popularity of tools for managing goals, performance feedback, and praise, like Lattice, Leapsome, or 15Five, has certainly contributed to the ease of exploring networks in organizations.
In the remote setup, these tools are introduced to encourage collaboration and feedback sharing between teams, departments, individuals, and the company, and enable the analysis of networks and the health of employee relationships.
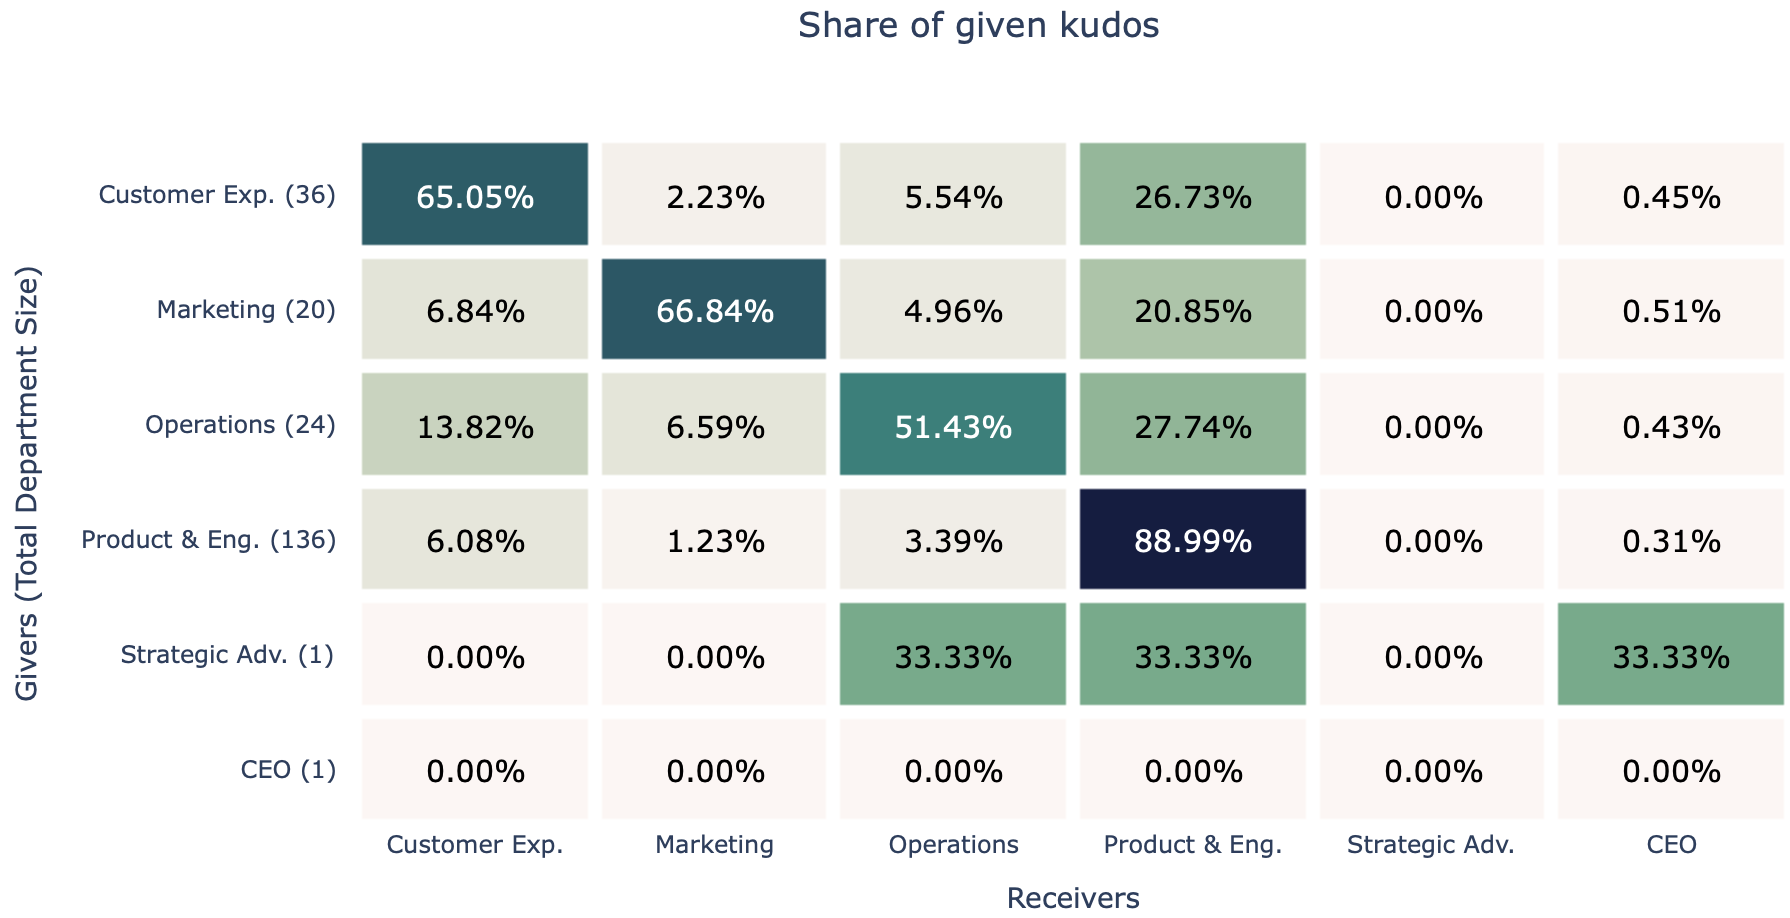
It is important to highlight that this approach focuses on the patterns of collaboration based on how people praise each other, and who is actually working on which projects with whom. The great advantage of looking into data in this way is that it’s not intrusive such as, for example, looking into chat or email data.
What’s more, just by tracking how people are praising or giving feedback to each other across teams, you can potentially detect the isolated groups. This is particularly interesting in the remote setting, where people barely have contact with their coworkers – without being proactive, they can experience real challenges when it comes to communication with colleagues and supervisors.
You can also overlay interdepartmental collaboration data with information about engagement. For example, you can track the engagement levels of, so-called, super connectors (i.e., the employees who have multiple and valuable connections with people in and outside the organization).
By monitoring the super-connectors’ engagement over time and its impact on the super-connector’s network, we can explore whether the super-connectors become more emotionally fatigued or cynical about their work, and detect a wider network of people that can get affected by their low engagement or burnout.
Environmental support
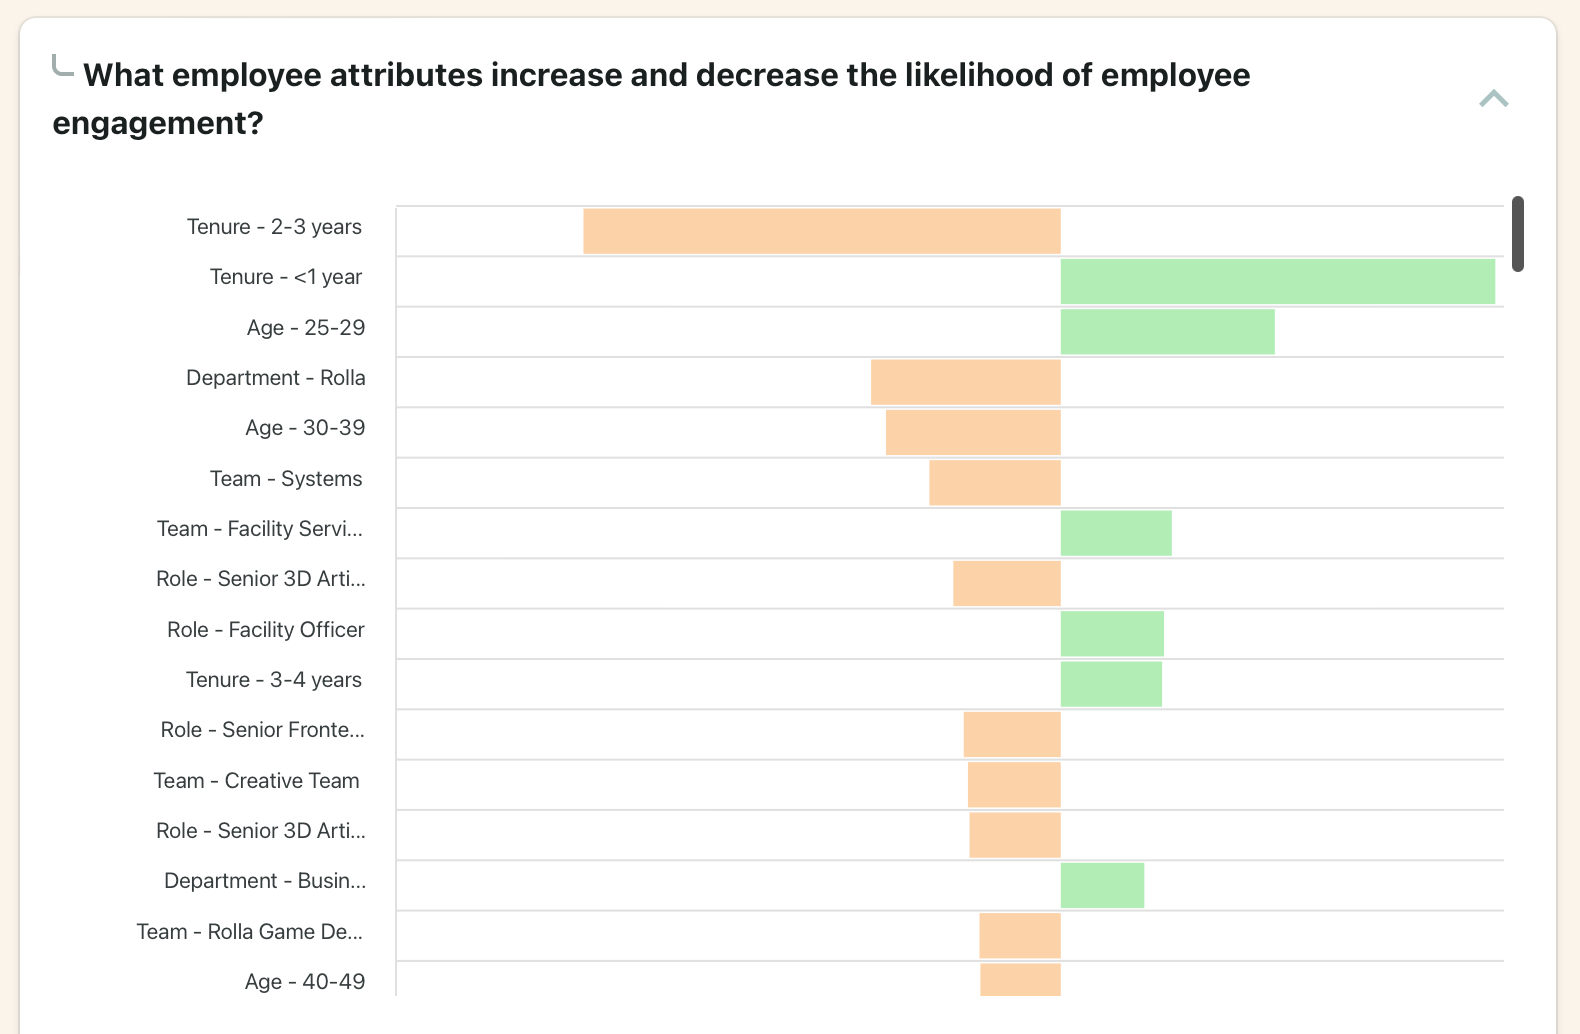
Burnout is one of the topics that has been particularly pressing in the past year. We can measure it using the Maslach Burnout Inventory (MBI). I encourage companies to analyze their own data and try to find out if any groups of employees are at higher risk of burnout.
A higher probability of burnout may be related to, for example, tenure or professional role. For example, looking at their data in Orgnostic, one of our users discovered that their risk group included senior employees, long-tenure employees and team leaders. At the same time, we saw that the elements of environmental support, like psychological safety or peer support, tended to decrease likelihood of burnout among these profiles.
Retention analysis
The last source of information I suggest looking at is retention analysis.
Analyzing retention using the turnover rate or data from exit interviews can be particularly informative as it allows us to analyze the employee experience from a different perspective.
For example, we can collect data about what employees expect to gain or lose by moving to the next employer. Such information can reveal both the quantitative and the qualitative sides of why people are leaving the company.
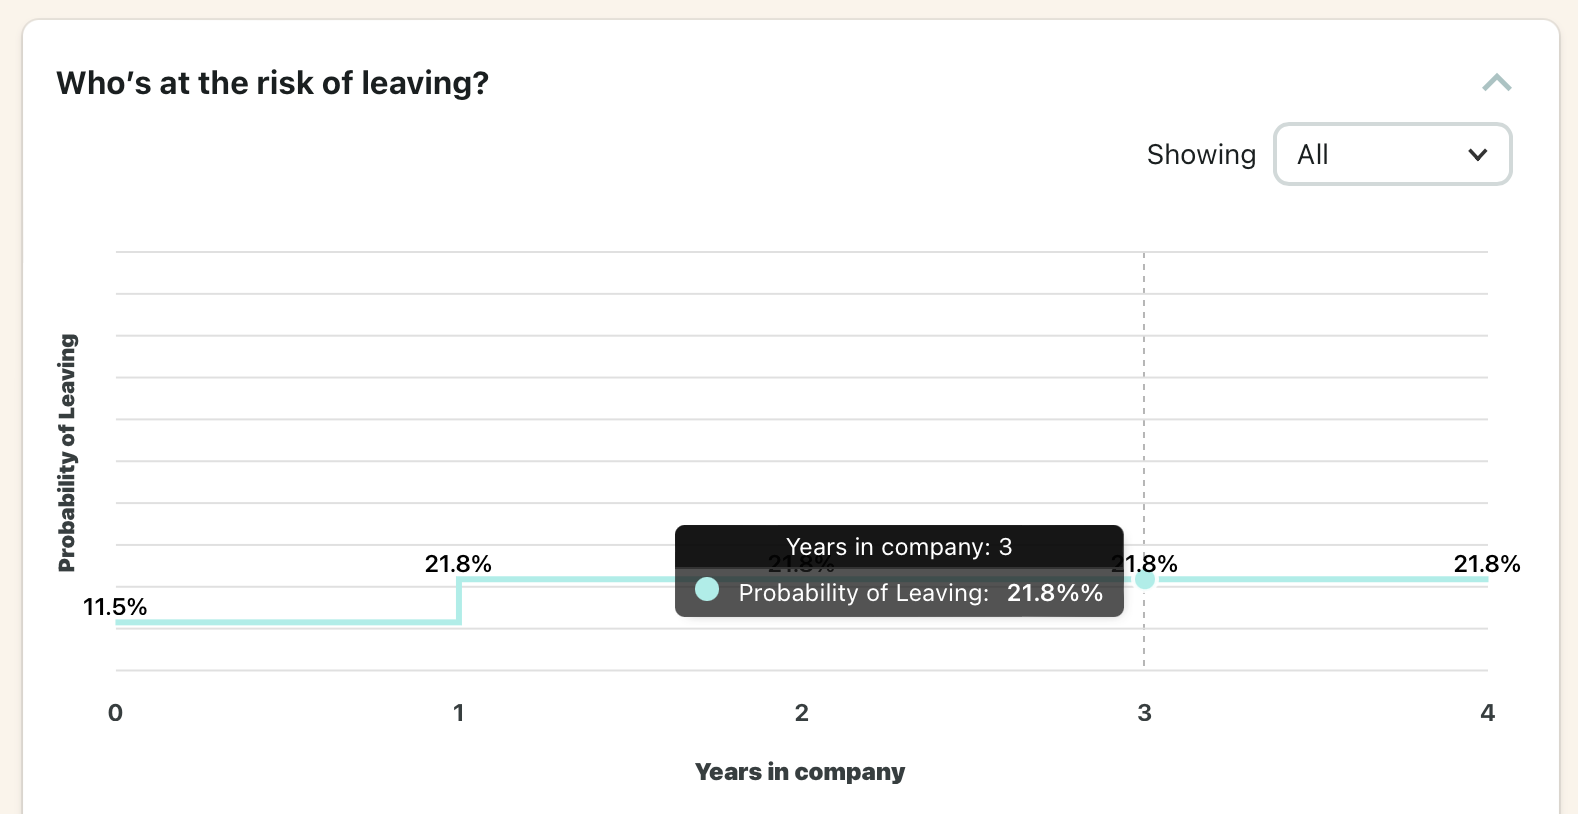
Another useful strategy is to break down turnover data by other variables. For example, you can look at turnover data through the prism of tenure. By running the reverse survival analysis on your employees and filtering through different employee attributes, you can get valuable insights about the likelihood of employee exits by different categories at different points of their career.
In that way, you can narrow down your focus to the employee segments where the risk of resignation is higher, dig deeper into their reasons for leaving, and take effective actions to reduce voluntary turnover.
To conclude
These are just some examples of how you can use data to answer questions like:
- “Why am I not able to hire the right talent?”,
- “How do our employees collaborate in a remote setup?”,
- “What employee groups are at the highest risk of burnout?”, and
- “When and why are my employees most likely to leave?”.
I hope that this article inspires you to explore these four groups of analytics and start 2022 by making your people management strategies more data-driven.