In this guide, we look at key metrics to track diversity, equity, and inclusion in your hiring efforts.
Diversity, equity, and inclusion bring ample benefits to organizations, but measuring DEI is a different challenge altogether.
We’ve created a guide to help you understand the key metrics you can use to measure diversity, equity, and inclusion in your hiring efforts focusing on:
- How to measure diversity in the applicant pipeline
- How to check if candidate experience is consistent across gender, age, ethnicity groups
- How to check average interview scores across applicants from different gender and ethnicity groups, and what this tells you.
Why measure diversity in hiring?
Before jumping to numbers and dashboards, it’s important to understand the why behind (measuring) diversity. Knowing this tells you where to look and informs the way you set and track diversity metrics. But why do it?
To start with, in a vast variety of studies, we’ve seen that group diversity has a positive impact on the performance of the team. Diversity, though, can mean quite many things — is it only demographic diversity or is it cognitive diversity too?
Also, most studies show that the diversity in upbringing also correlates highly with cognitive diversity. Still, the general convention is that diversity increases the richness of ideas and perspectives based on which team members are more likely to act upon.
When team members are diverse, their collective performance comes with a diversity bonus — a quantifiable, tangible value add that challenges narrow, meritocratic meaning, improves problem-solving, increases innovation, and helps make more accurate predictions.
Lastly, aiming for diversity is the right thing to do as well. We all suffer the human condition and are prone to biases that lead us to select suboptimal leaders and treat people differently based on trivial lizard-brain impulses that do not hold the truth in reality.
So, now that we have the ‘why’ covered, let’s start at the top — measuring diversity in the applicant pipeline.
Getting started: collecting hiring data
Throughout this guide, we’ll be looking at metrics that span the entire hiring journey from applicant pipeline diversity to the hiring funnel conversion rate for specific groups.
Some of these metrics require that you do the initial setup to be able to track them over time.
To get the most out of your diversity tracking, you need to have the following data sources ready before you get started:
- An ATS
- An HRIS
- Survey data
Combo of these tools would help you greatly acquire and structure the data and keep clean so that you can do an ongoing analysis. That goes without saying that you can cover everything in spreadsheet too, although you might find it a bit harder to vouch for the integrity of your data.
Question 1: How diverse is our applicant pipeline?
When tackling hiring diversity, there’s a tendency to point to the applicant pool and say there’s a “pipeline problem”, even though this argument isn’t data-backed. This shifts the blame from the company processes to education and other external factors.
To track it in our own companies, we need two metrics: the pipeline diversity ratio and the hiring funnel conversion rate.
How do I calculate my pipeline diversity ratio?
Let’s start at the top of the funnel. The Pipeline Diversity Ratio helps you understand how diverse the top of your hiring funnel is.
One of the first steps you can take to increase diversity in your company is to expand your talent pool by creating more inclusive talent attraction practices. If candidates aren’t attracted to the role, they won’t apply.
You can calculate your pipeline diversity ratio for any group of applicants.
Here are two examples by gender and racial group:
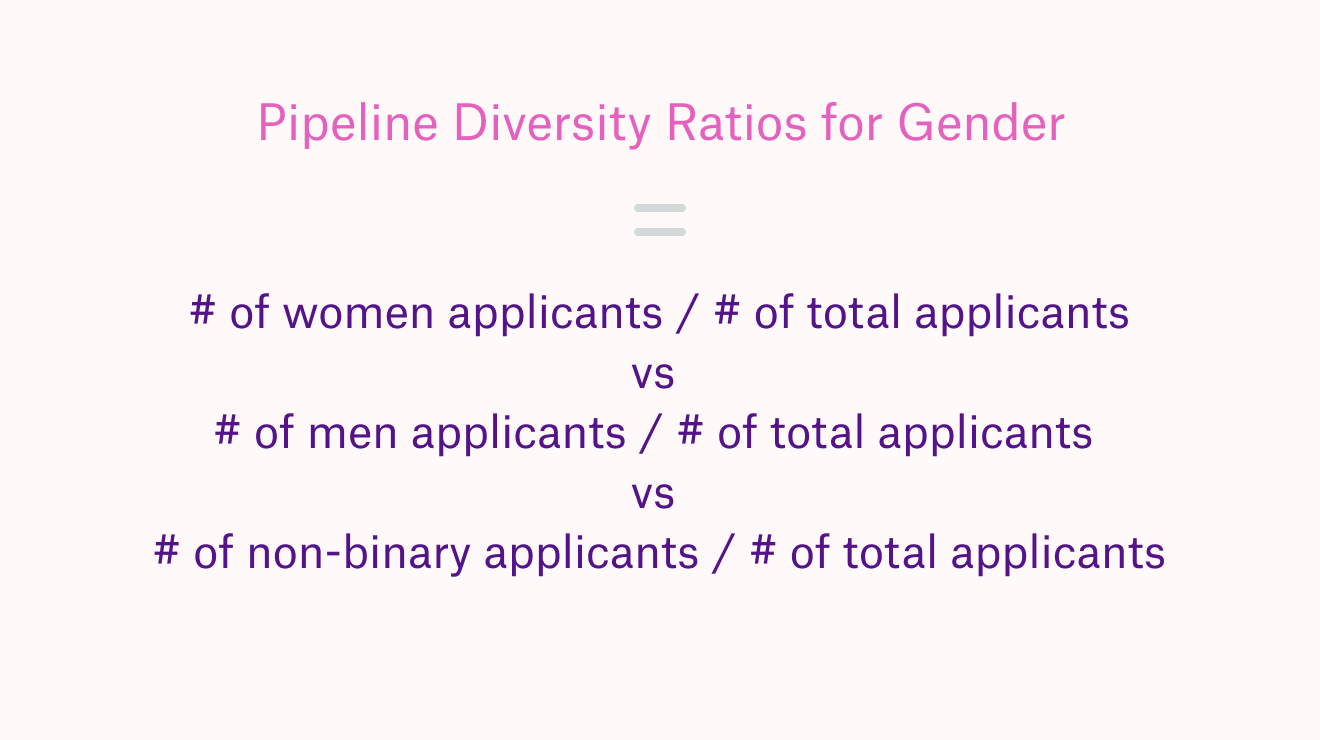
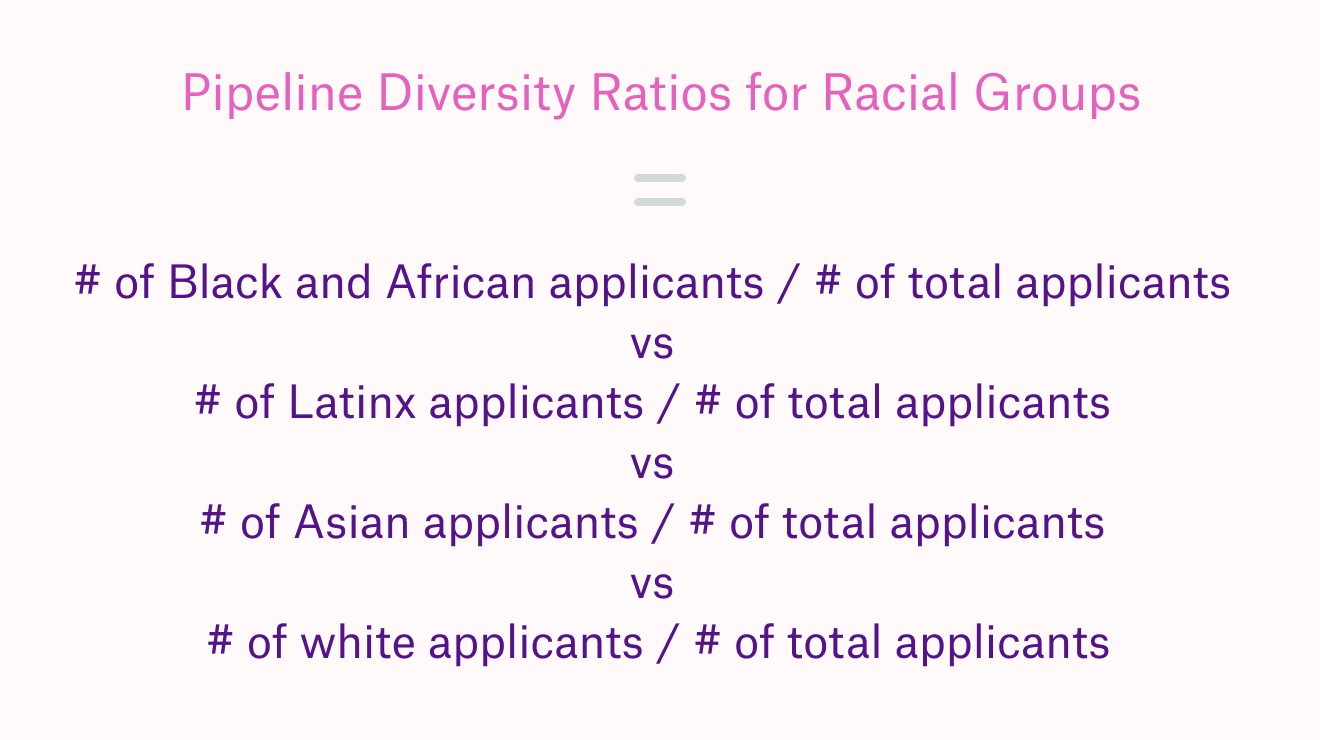
You can make two key modifications to these formulas: first, the relevant racial groups for your region or company may be different. Second, you may want to filter this further by using qualified candidates instead of all applicants.
Now, the whole applicant pipeline is more than just the top of the funnel. Let’s see how you can factor in the conversion rates at each step. A caveat here — this data is impossible to get in some locations. And to obtain it, you need to run anonymized candidate experience surveys and ask about demographics to be able to get an estimate of your pipeline sizes.
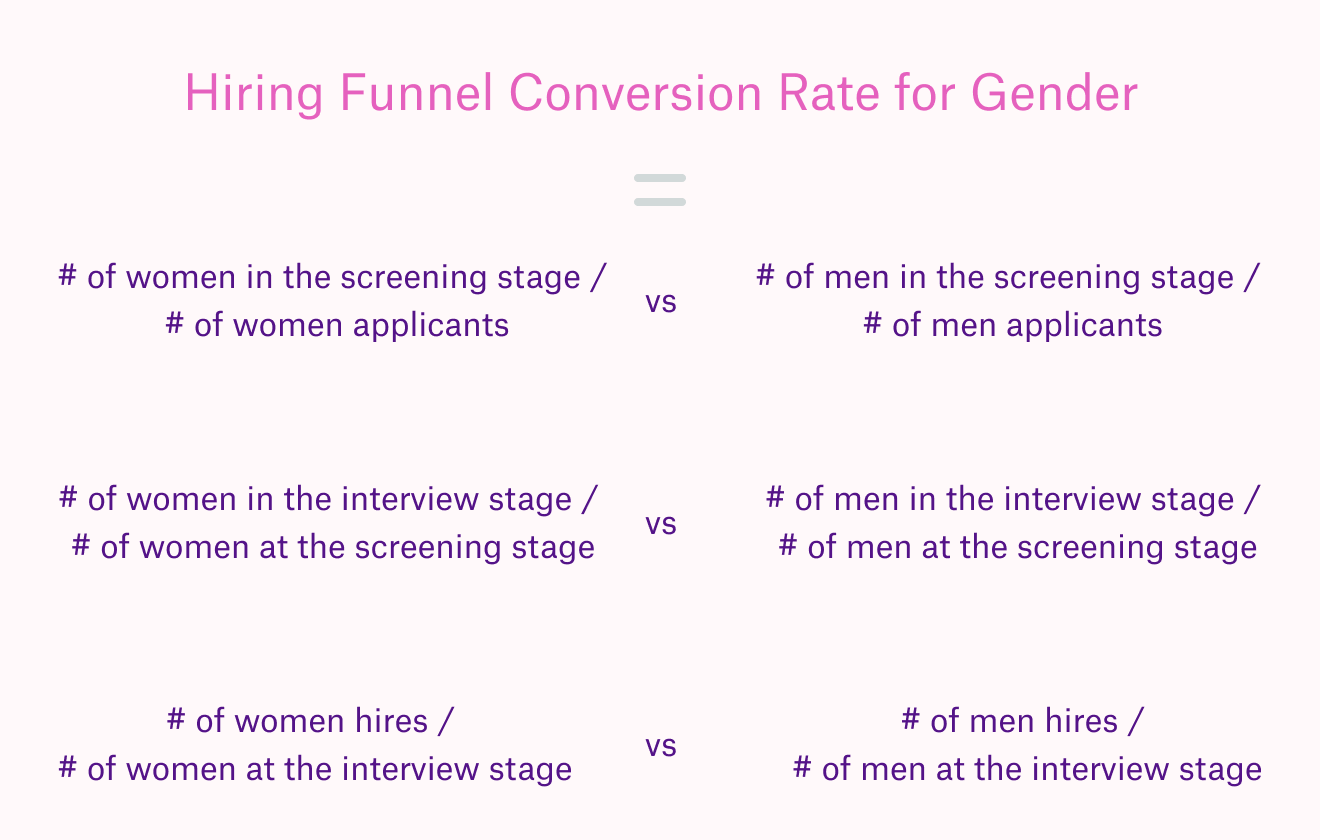
How do I calculate my hiring funnel conversion rate?
For the different groups above, you can find the conversion rate from one step in your hiring process to the next. Let’s look at two examples of how to find hiring conversion rates.
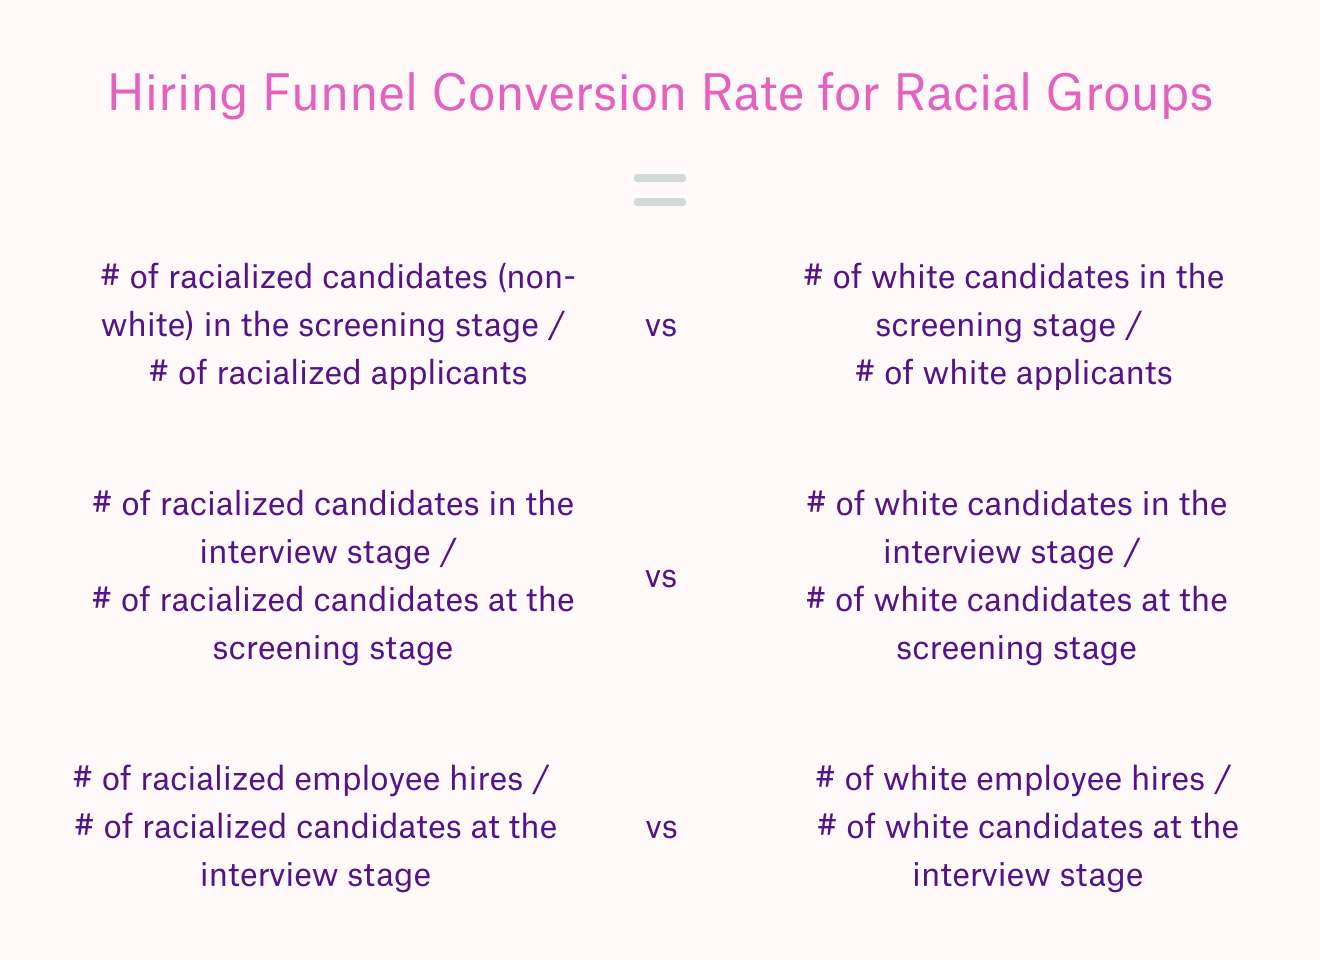
While this approach can oversimplify racial groups, you need to strike a balance between having a large enough sample size for each category and getting detailed insights on all groups of interest.
Complicating things further, some applicants may not respond to the questions in the surveys you send out to get this data. That’s why it’s important to explain why you’re collecting sensitive demographic data and explain what you will (and won’t) use it for.
What to do next about your pipeline diversity
Once you know if you have a pipeline problem, a hiring process problem, or neither, you can act appropriately.
If the top of your funnel isn’t reflecting the broader talent pool, then you can use other sourcing channels (see this step-by-step guide on finding the most cost-effective sources). Here it’s also good to look at the top of your funnel to check if your messaging is biased and whether your hiring ads and messages are more geared towards a particular demographic.
And if your process is not balanced, take an evidence-based approach to redesign your decisions at every stage of your hiring process.
Question 2: Is our candidate experience consistent across different groups?
Make sure your company is attractive to all qualified candidates.
Even when you have many applicants, you want the most qualified ones to accept your offer. Candidate experience is key even when your pipeline is full.
All candidates want a positive experience when applying for a job with you. As most applicants won’t already have intimate knowledge about your company, hiring is the closest they will get to know what it’s like to work with you. Unfortunately, some companies don’t give this part of recruiting the attention it deserves.
To know what your candidate experience is like, you need to measure it.
Once you’ve started tracking the elements that make up this metric, you’ll want to know if all applicant groups feel the same way.
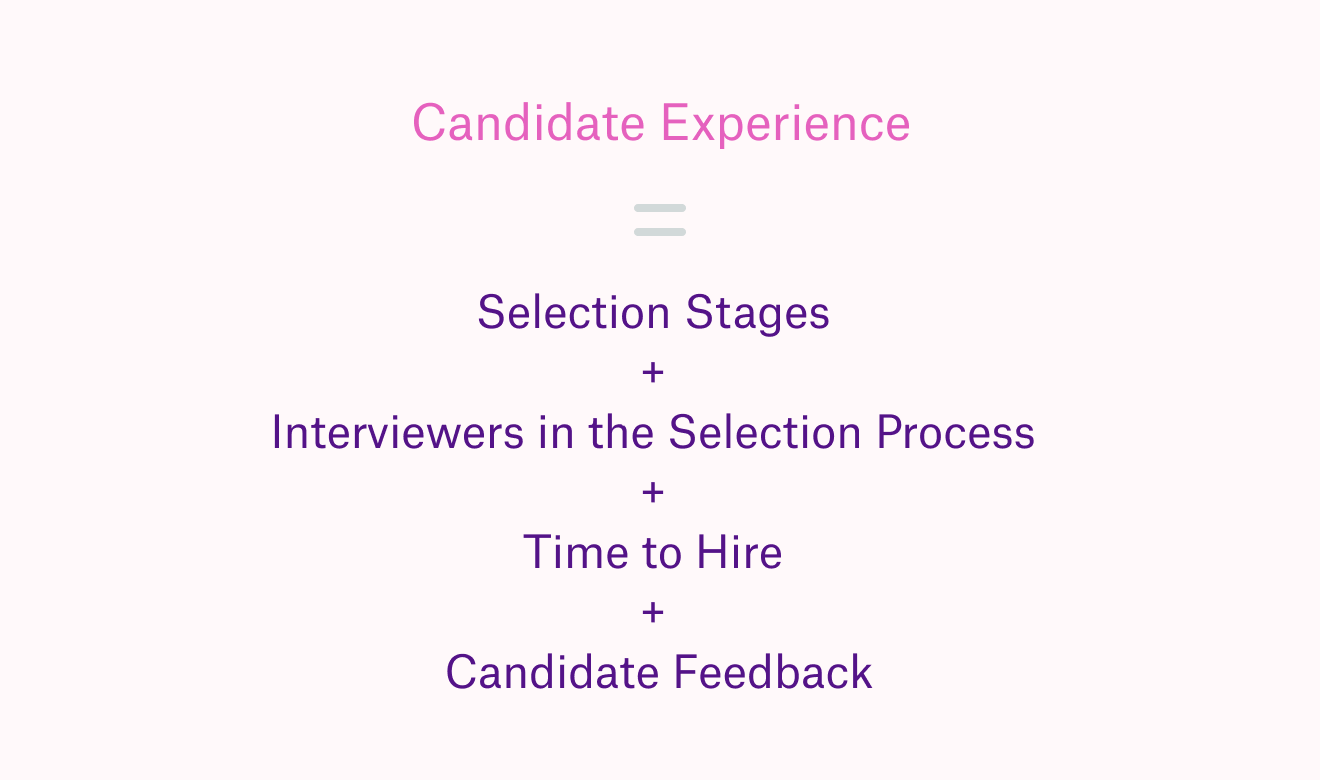
How do I calculate candidate experience?
Candidates’ experience comprises many factors at each stage of the hiring process. These include the number of selection stages, the number of interviewers in the process, the time to hire, and feedback from candidates directly.
Factor 1: Selection Stages
What’s the average number of selection steps you take to hire a candidate? Standardized recruitment processes tend to be more equal in the number of stages each candidate goes through, regardless of the candidate’s background. This is one way to reduce the effects of implicit bias on hiring decision-making.
Here, you can track:
- the minimum number of stages
- the maximum number of stages any one candidate went through, and
- the average number of steps involved.
Factor 2: Interviewers in the Selection Process
Does every senior leader need to meet with every candidate? By counting the unique number of interviewers in the process, you can see how unwieldy your decision-making steps are. Standardized hiring tends to have low variation in how many people participate in hiring, to reduce the impact of implicit bias and keep candidates’ experiences consistent.
Factor 3: Time to Hire
How long does it take you to finish the whole hiring process? Time to Hire measures the time between the moment that the chosen candidate applied or was approached for the position to the moment that the offer was accepted.
This metric is candidate-centric — it focuses on the time the candidate spent in the hiring process. Time to Hire indicates how predictable the hiring process is and is a proxy for the candidate’s experience through the recruitment process.
Factor 4: Candidate’s Feedback
Candidates’ reactions play a large part in whether they accept an offer, and positive experiences help boost your employer branding by better word of mouth. You can gather candidate feedback through surveys sent out to candidates after their final hiring stage and gather information from review sites like Glassdoor.
One article used Glassdoor interview reviews to look into tech hiring processes. Although some companies had very selective and difficult interview processes, the majority of candidates had a positive experience. In fact, good candidate experiences can go hand in hand with some of the most difficult interviews. Glassdoor’s ranking of companies with the highest interview difficulty also showed positive candidate experiences.
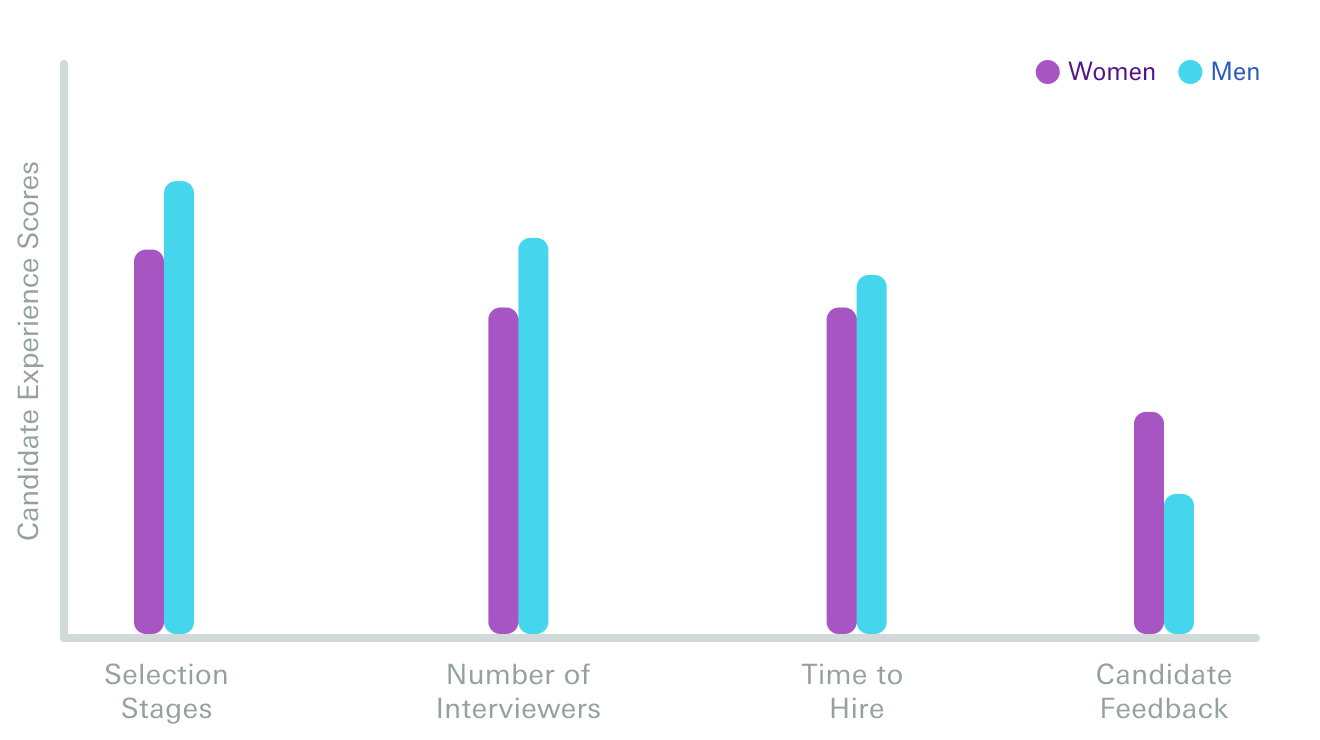
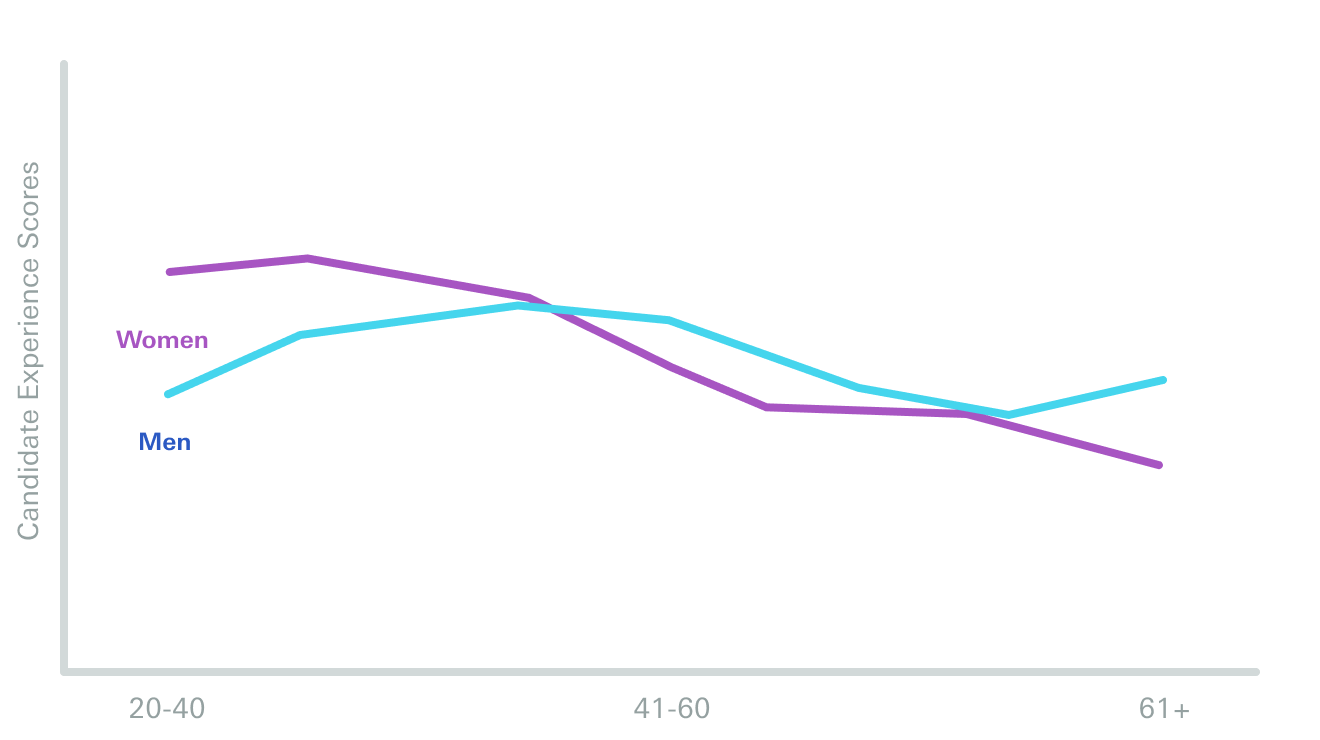
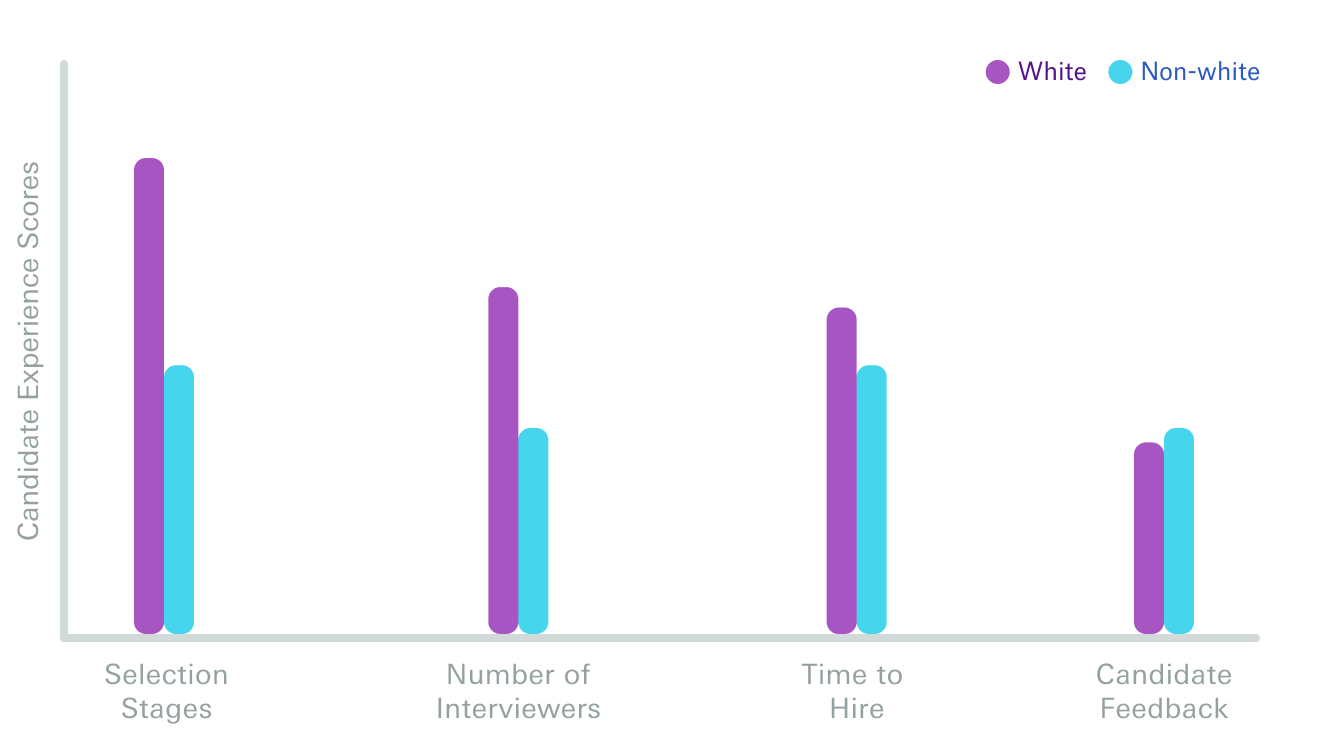
It’s not enough to know if candidates overall had a good experience with your hiring process. We’re here to talk about whether candidates from different demographic groups feel the same way.
Once you’ve gathered these measures of candidate experience, and/or others that work for your company, you can look for parity across gender, age, and racial lines.
Here’s what that looks like:
What to do next about your candidate experience
Now that you can see if there are group differences in candidate experience, you can make changes to your process and track the impact.
For example, you may not need as many interviews per hire as you thought: this can reduce the number of selection stages, interviewers, and days to hire while improving candidate feedback.
Alternatively, changing the way you evaluate skills may benefit some groups that could be poorly served by existing approaches, like neurodiverse applicants. This could lift candidate experience scores for one group and bring them in balance with another. Candidate experience improvements come in many forms; the only way to know what works for your company is to test and track the changes.
How to skip the manual work?
Calculating candidate experience scores manually requires a lot of work.
You need to extract the data for each metric that contributes to the overall candidate experience — often kept in different data sources, like spreadsheets or tools. You then need to combine those data sets, clean, analyze, and visualize them.
If you want to skip all the manual work, you can use a people analytics platform, like Orgnostic, to answer questions like this a lot faster.
When it comes to measuring candidate experience, Orgnostic lets you track time to hire, number of interviewers, and selection stages.
Here’s how to do it:
- Register on the Orgnostic Platform
- Connect your ATS and your data will be automatically available for analysis
- Head over to Story
- Click on the Talent Acquisition chapter
- There, go the Candidate Journey metric.
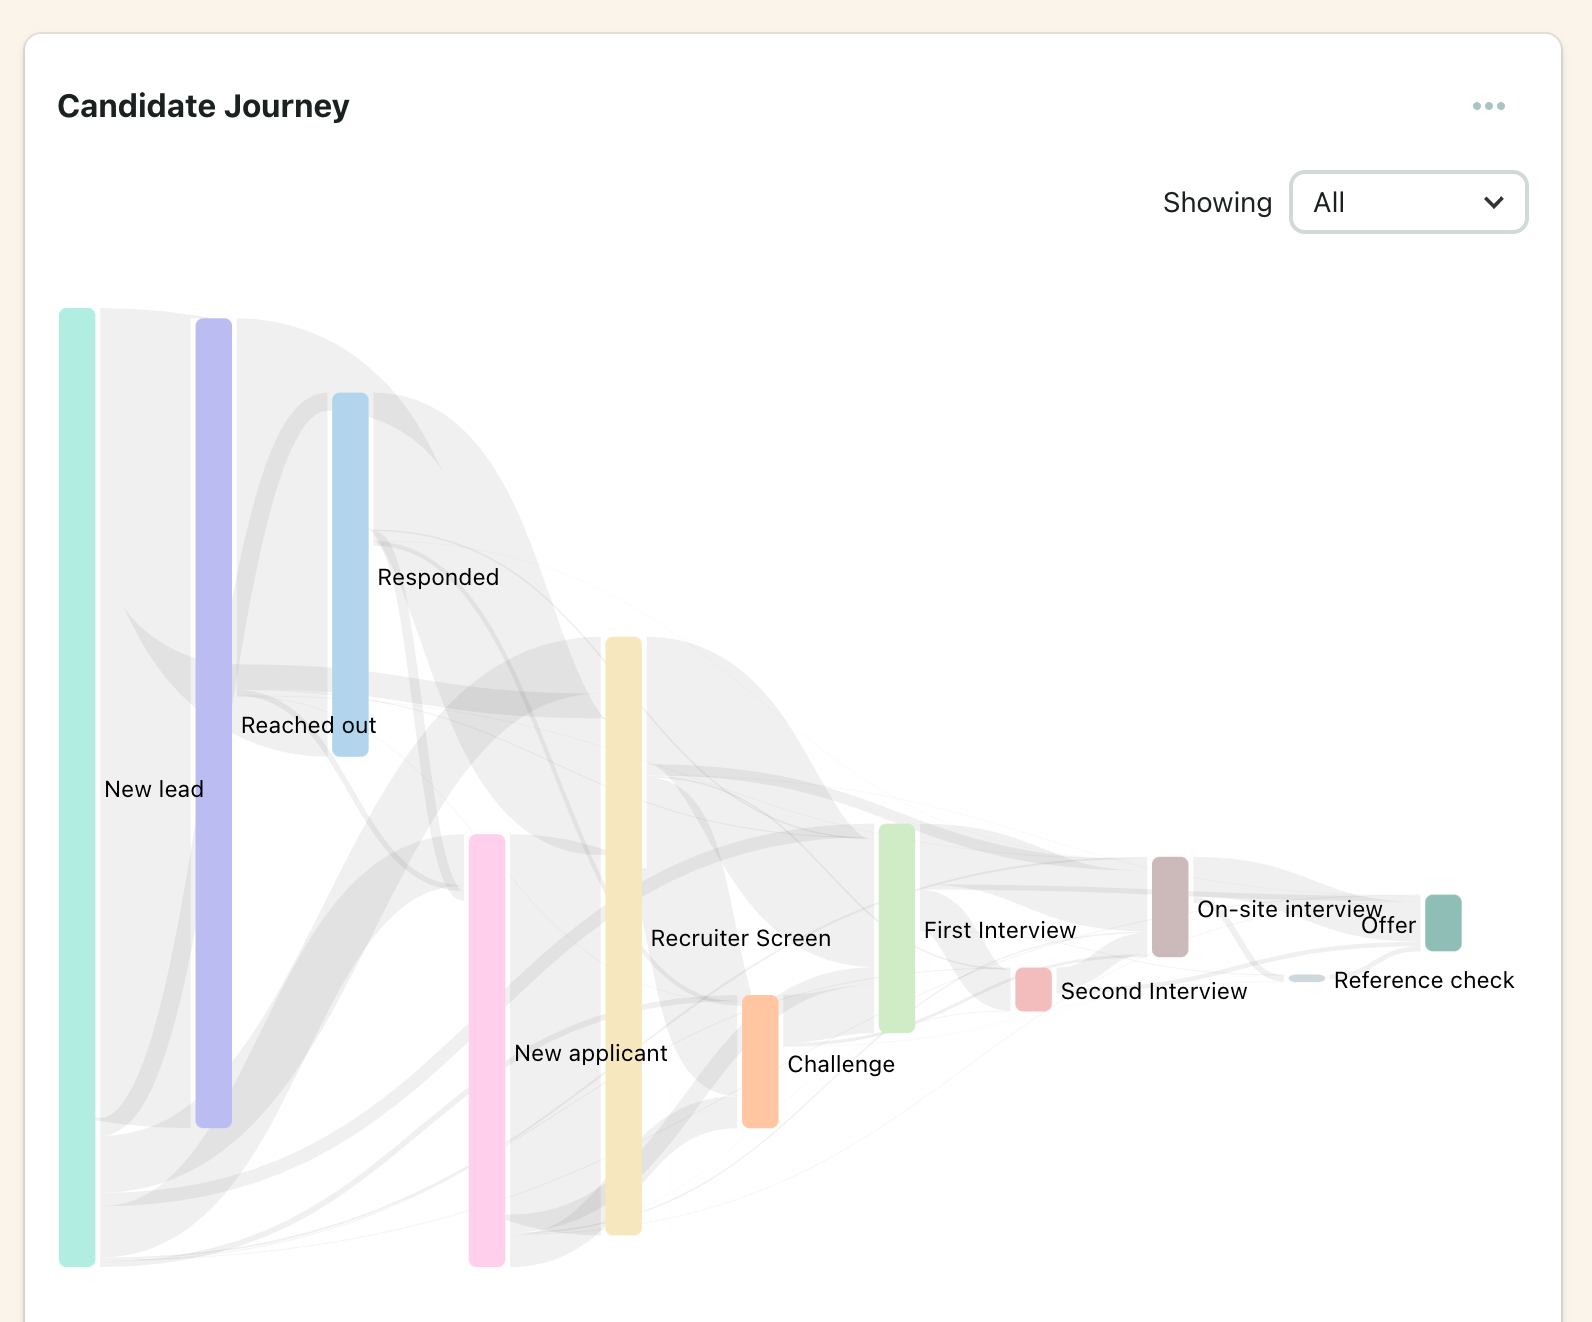
Candidate Journey gives you an overview of candidate’s experience throughout the hiring process. You can filter these insights across departments, roles, locations, and teams, following the stages of recruitment you have previously defined in your ATS system.
Question 3: What are the average interview scores across applicants from different gender and ethnicity groups?
If you want a fair and consistent hiring process, you need to look for interview score differences.
We already covered how to know if you truly have a pipeline problem that creates representation problems. But there’s so much more to fairness and equity in hiring, especially for your most critical hires.
No matter how many blind resume screening tools you adopt, we bet your hiring process uses interviews.
The challenge is that interviews, especially unstructured interviews, can be inconsistent and biased. Winging it, just getting a feel for the person, and not using a structured scoring system means that interviewers will make snap judgments that are less accurate.
These snap judgments happen in the first few seconds of the interview. In an unstructured interview, these first impressions mean the interviewer’s mind is often already made up before a candidate opens their mouth.
To combat this, you need structured interviews and a consistent scoring system. Without interview scores on key dimensions relevant to the job, you can’t start to look for discrepancies in your interview scores across groups. Let’s look at how to calculate interview scores.
How do I calculate interview scores?
Interview scores allow you to see if there are any systematic differences in how you score candidates across different groups, like their team, position, and demographics. Score differences can be a symptom of biases in your hiring process.
Example scoring formats can be very simple, such as a single, overall score. This is the least nuanced approach, which is most prone to snap judgments. On the more sophisticated side, scoring systems can take an average of scores on multiple skills tested in the interview, with each skill aligned to the role. This is the most comprehensive and potentially accurate approach. Let’s take a look at how you might use these scores.
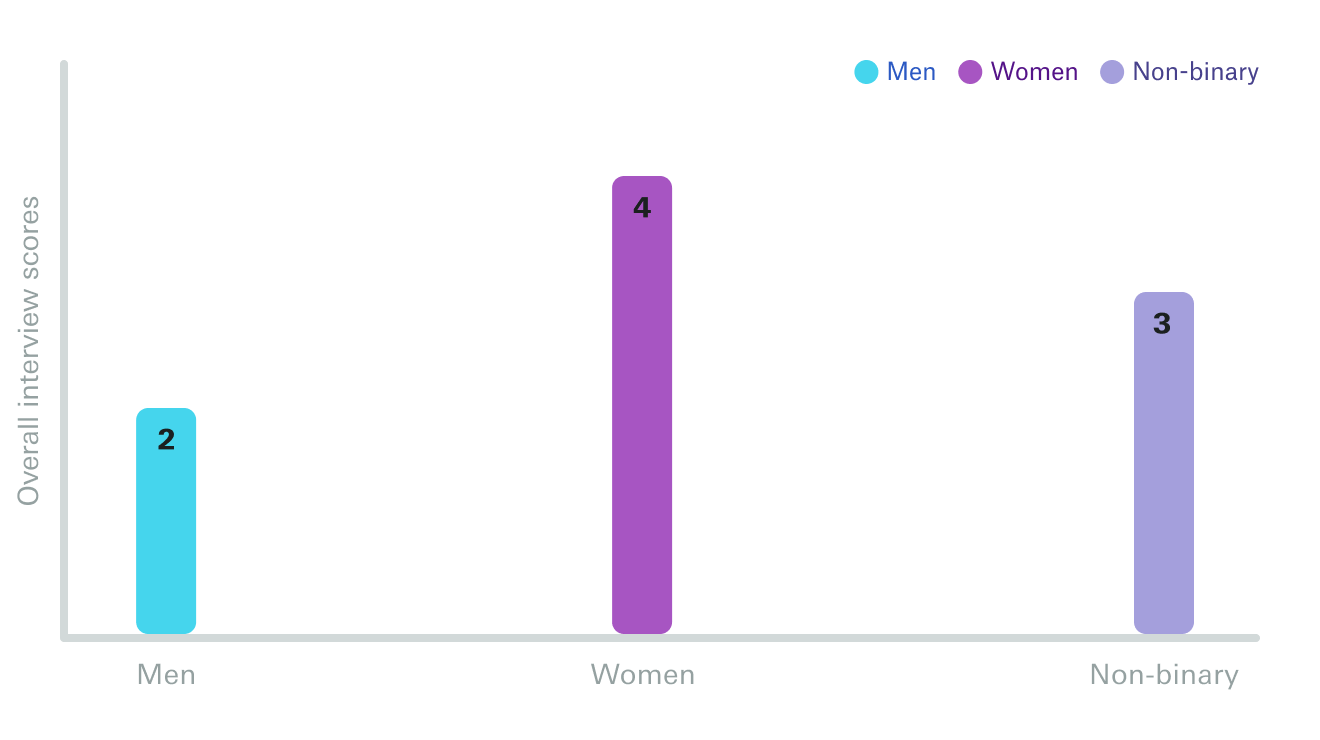
Using an overall score lets us know what interviewers thought about candidates of each gender as a whole.
However, eyeballing these bar graphs is not enough to know if there’s a real difference here, not just some error that could happen due to chance.
To know if you have a substantial difference between candidate groups, you can use statistical approaches like a t-test or an ANOVA.
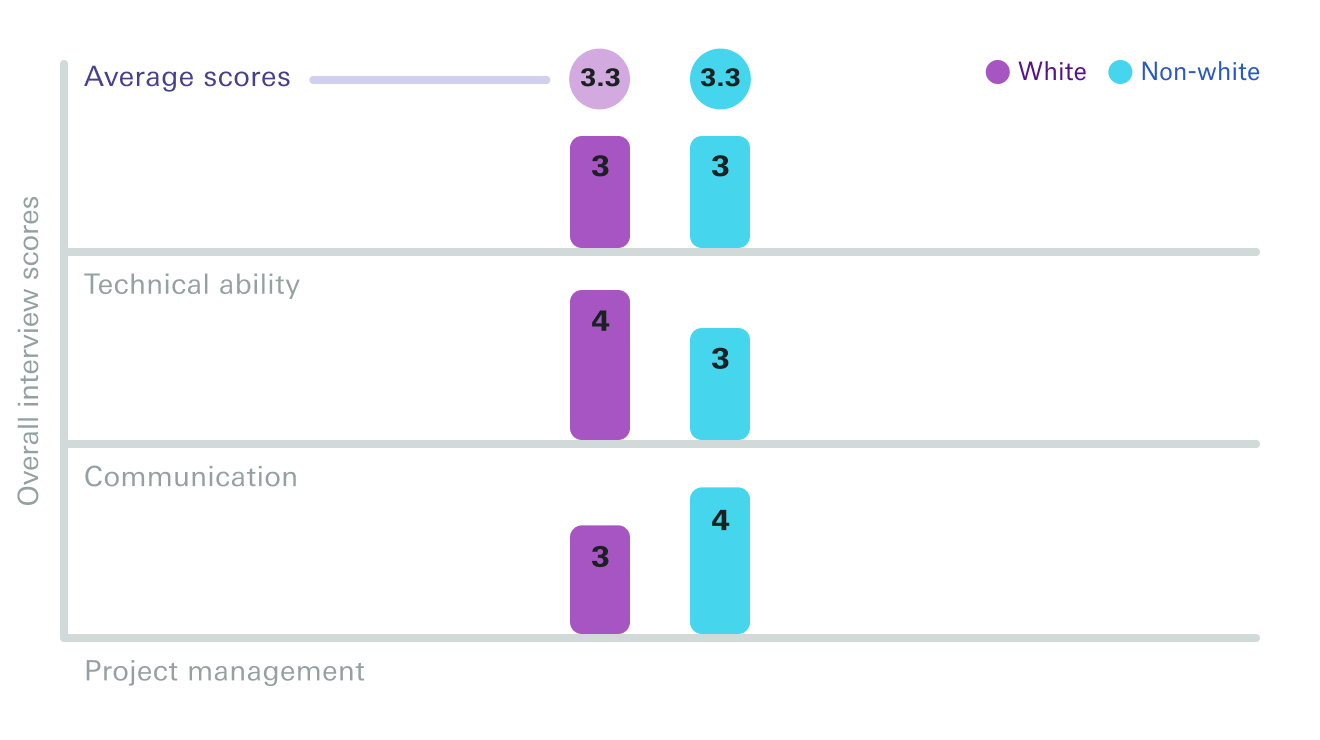
Using a scoring setup like this, the narrower skill categories can show you nuances that an overall score could obscure.
As we’ve said before, race and ethnicity are complex, and lumping together all non-white candidates can oversimplify and cover up differences that may truly be there.
Yet with all data-driven approaches, groups with too few people can add lots of error and randomness to your comparisons. If you have enough people in each group (i.e., 20 candidates at the very least, ideally many more), then you can be more confident in finding true, though mostly medium to large, differences between groups.
What to do next about interview scores
These score differences can happen for many reasons. You could find the men you interview are more specialized in relevant areas to your business, or you may learn that Black candidates have unique work experiences that contribute to higher scores on communication.
Interview score differences are not definitive proof that your interview process is discriminatory.
However, substantial differences are worth a deeper look to find out the cause of these gaps. After investigating this, you can look at how base salaries may be different across groups in the same roles.
How to automate measuring interview scores?
If you’re caught up in reports week after week, you can try out a people analytics platform, like Orgnostic, that lets you break free from endless copy-pasting data across spreadsheets or extracting them from existing tools.
Instead, you can connect all your data sources and get reliable insights much faster.
For instance — Orgnostic lets you integrate, filter, visualize, and track interview scores — all in just a couple of steps:
- Register on the Orgnostic Platform
- Connect your ATS or other interview-scoring platform into Orgnostic
- Once your data is ready, head over to Story
- Then, go to the Talent Acquisition chapter
- There, head to the Feedback Rating Distribution.
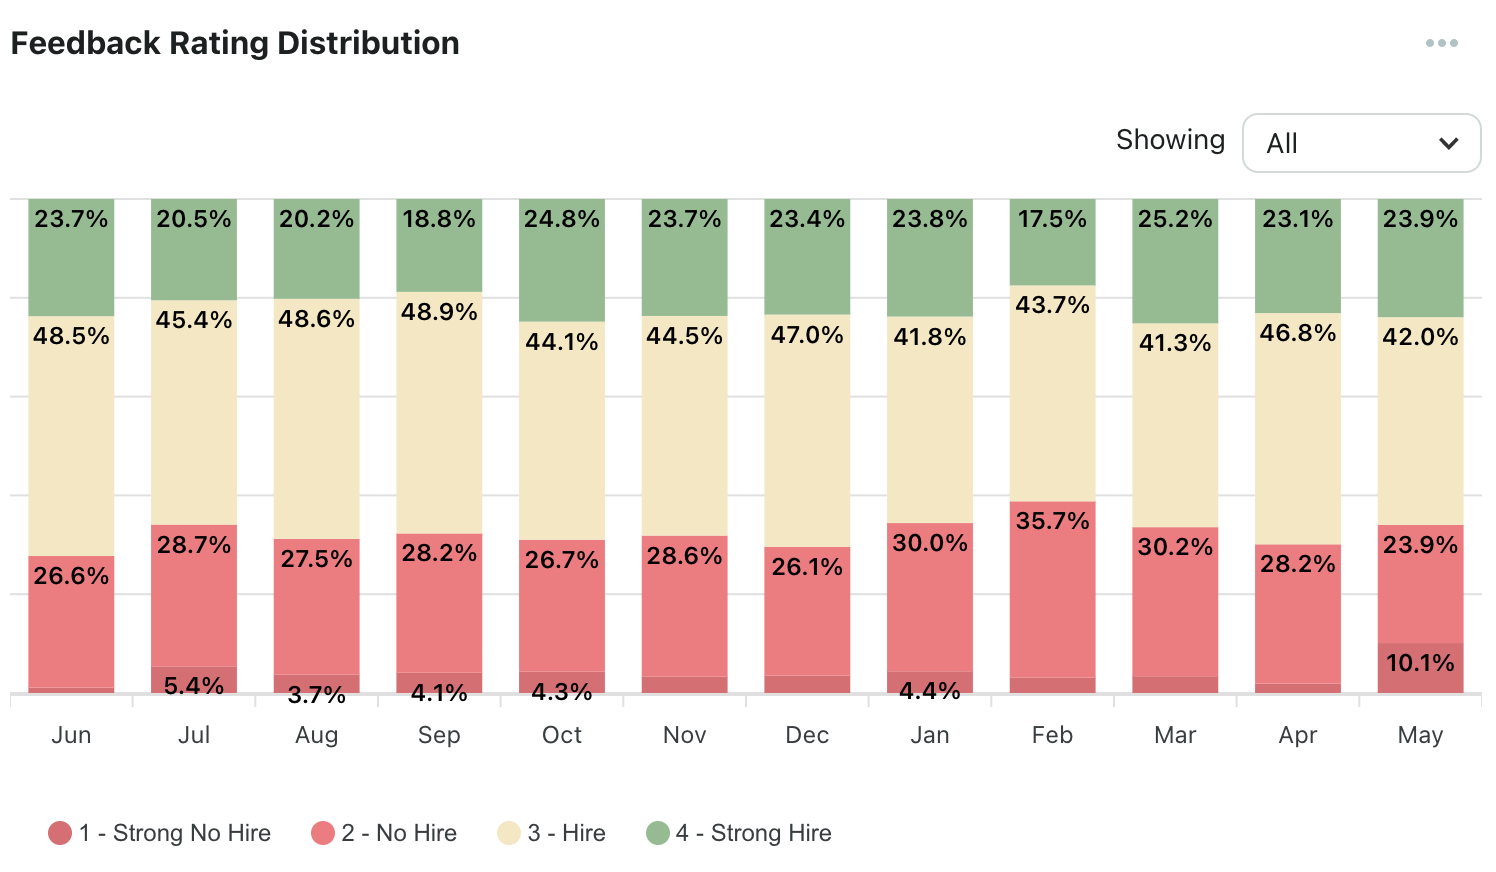
Within the Feedback Rating Distribution metric, you can check for any systemic differences in the scoring of candidates across teams, positions, and demographics, which in turn can point to any biases in your recruitment process.
Once you can see a visual representation of how your candidates score in interviews, you can test bias-reducing techniques like structured interviews and job analysis while tracking the impact on interview ratings.

From the Diversity, Equity, and Inclusion series:
- Do All Employees in the Same Roles get Equal Compensation?
- How Many Critical Hires That We Make Are Women and Minorities?
- Are Women and Minorities Promoted as Often as the Rest?
- What Is the Diversity Breakdown of Our Top Performers and High-Potential Employees?
- What Is the Distribution of Women and Minorities Across Job Levels?