Without equal opportunities for growth, we can’t build a diverse culture and inclusive people practices.
Diversity, equity, and inclusion in business is not a new movement. For decades, companies have been working on representation and fairness issues. Unfortunately, some changes take much longer than others to take effect.
Atlassian recently changed their representation of women in tech roles by 80%. Lever reports that 51% of its employees are from underrepresented racial groups. Although these are impressive changes in representation, senior levels of the business are usually slower to change. For example, there are zero Black women and only four Black men leading Fortune 500 companies. Across the United States in 2018, only 3.3% of senior leadership and executive roles were held by Black professionals. Overall, diversity in senior leadership is still low.
These low numbers contrast with who is entering the workforce and who is working in entry-level positions. For example, Black and Hispanic students in the United States are hired into top tech companies at half the rate of their graduation from computer science and engineering degrees.
Some companies overall have a balance in gender and racial identity in their company. But when we look deeper, historically underrepresented groups are clustered in lower level roles. In some cases, the headquarters of companies are staffed with overwhelmingly white and upper-class workers, while frontline positions have more diversity. Employees from underrepresented groups might not be promoted as often as other groups of employees are, leading to very different representation at the top than at the bottom. This could reflect differences in your high-potential programs and among your top performing employees.
Getting to gender or racial parity overall can still leave a company with divisions, just like we explored in this article about the diversity of your mission critical roles. Let’s find out how to test whether your company’s demographics are balanced, at all levels.
Are your underrepresented employees all entry level?
Fortunately, it’s easy to find this information with a few pieces of data. If you have the demographic information and job level for your employees, you’ve got it! You can make a graph and run statistical tests to see if you have differences across job levels and measure how large these gaps are. Or you can use our plug-and-play metrics on the Orgnostic platform for this. Here’s an example of how you can calculate it on your own:
Gender Distribution By Level
Entry Level = # of women at entry level / # of employees at entry level vs # of men at entry level / # of employees at entry level vs # of non-binary employees at entry level / # of employees at entry level
Mid-Level = # of women at mid-level / # of employees at mid-level vs # of men at mid-level / # of employees at mid-level vs # of non-binary employees at mid-level / # of employees at mid-level
Senior Level = # of women at senior level / # of employees at senior level vs # of men at senior level / # of employees at senior level vs # of non-binary employees at senior level / # of employees at senior level
Instead, maybe your company uses standardized levels and codes associated with them through the whole company. Some job seekers even use these codes to compare across companies, with tools like PayScale and levels.fyi. With codes like this, you can find the percentage of employees at each level. Here’s an example with a six-level company structure:
Racial Distribution by Level
Level 1 = % of non-white employees at Level 1 vs % of white employees at Level 1
Level 2 = % of non-white employees at Level 2 vs % of white employees at Level 2
Level 3 = % of non-white employees at Level 3 vs % of white employees at Level 3
Level 4 = % of non-white employees at Level 4 vs % of white employees at Level 4
Level 5 = % of non-white employees at Level 5 vs % of white employees at Level 5
Level 6 = % of non-white employees at Level 6 vs % of white employees at Level 6
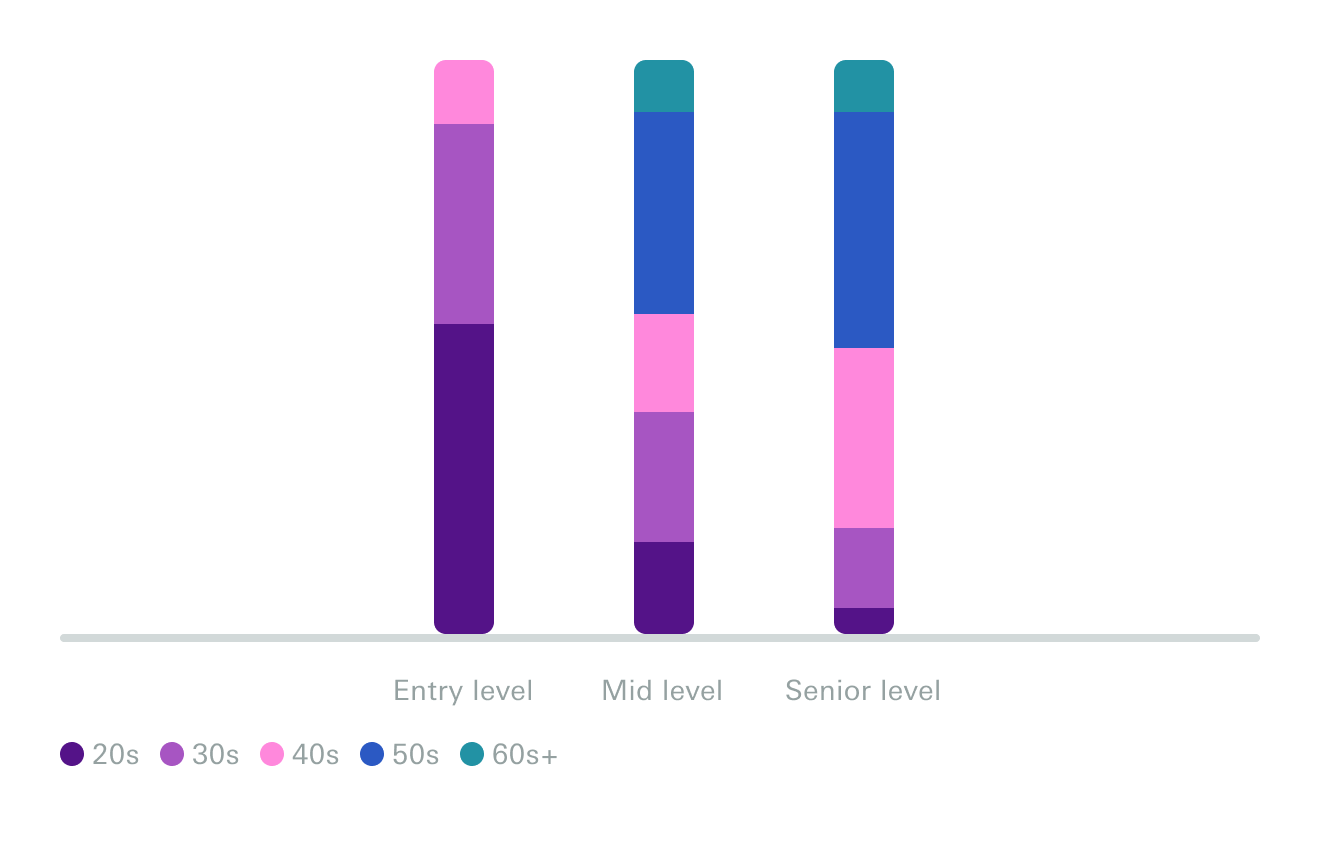
Visually, these metrics can be represented in a series of pie charts or a graph where each column adds up to 100%. Here are some examples:
Age Distribution by Job Level
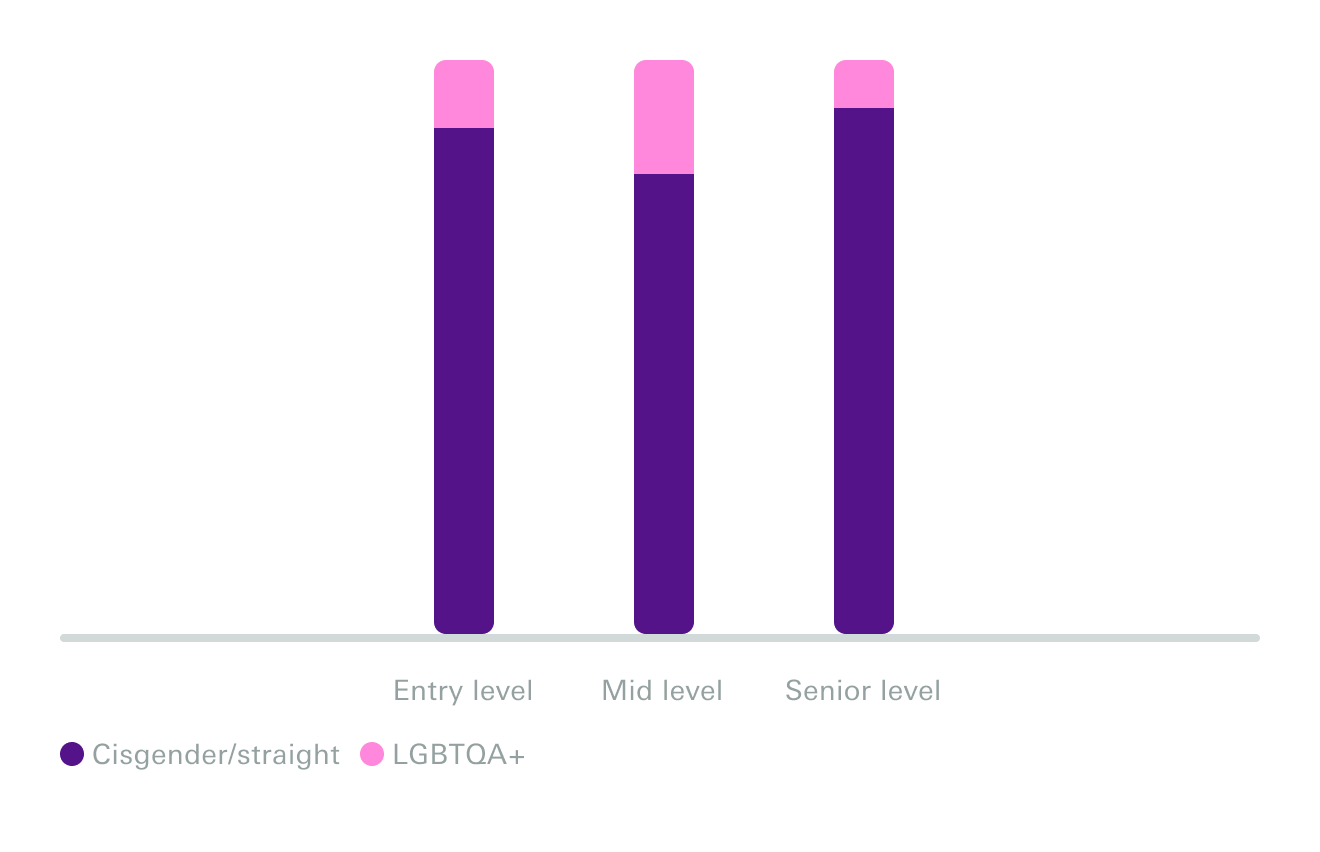
LGBTQA+ Distribution by Job Level
So What?
With these metrics and graphs above, we can see if there’s a representation gap between entry-level and higher positions. If your company has one of these gaps, there may be many reasons why:
- Racial assumptions get in the way: Delays in promotions for Black employees in the US can come from stereotypes that Black employees are overly aggressive or incompetent
- A lack of mentorship creates a Catch-22: Businesses that don’t have racially diverse leaders or role models may find their underrepresented employees don’t progress upwards as easily
- Promoting diversity can be dangerous: In one study of 350 executives, women and non-white executives were penalized for “diversity-valuing behaviours”, like advocating for an underrepresented perform to be promoted
Don’t let these barriers discourage you from working towards solutions. Here are some approaches to test out in your organization:
- Implement a mentoring program: In a review of over 700 companies across 30 years, mentoring programs helped to increase representation in management
- Set clear and consistent promotion standards: A lack of structure and shifting criteria in performance evaluations can hurt promotion chances for non-majority groups. Adding helpful guidance and structure can help managers to be more objective
- Hold managers accountable to a diverse promotion committee: The background of people on a promotion committee matters if you’re looking to improve the equity of your promotion decisions
How do I answer this question in Orgnostic?
Orgnostic makes it easy to find gaps in employee representation by level. Simply connect your HRIS to the Orgnostic platform: if you have demographic information on your employees linked to their job level, you’ll get Gender Distribution, Ethnic Distribution and Age Distribution metrics out of the box.
From the Diversity, Equity, and Inclusion series: