Organizations need solid retention strategies more than ever. Luckily, organizational data can help you design and implement a sound action plan to keep employees from leaving. Here’s how.
Before you start designing a retention strategy, you should look into your organization’s data. This helps you understand which factors contribute to employees leaving the organization and gives you input into what problems your employee retention strategy needs to solve.
So, in this post, we look at key metrics that should guide the way you design and implement your employee retention strategies.
How to build a sound employee retention strategy
To create a comprehensive employee retention strategy, there are two broad data sets you need to look at — data on turnover and data on employee experience. Putting these two together lets you run thorough diagnostics and act accordingly.
Data on turnover includes information such as the number of people leaving the organization, as well as departments, teams, and roles with the highest level of turnover. This is the systems data that you typically get from your people analytics tool.
But this is just one part of the equation.
Knowing how many people have left a particular department in your organization still tells you little as to why employees have been leaving that particular department in the first place.
To learn that, you need to look at data on employee experience, which comes from your employee listening efforts, such as feedback you get through employee surveys.
By marrying these two, you can put in place a retention strategy that addresses employee turnover in a contextualized, comprehensive way.
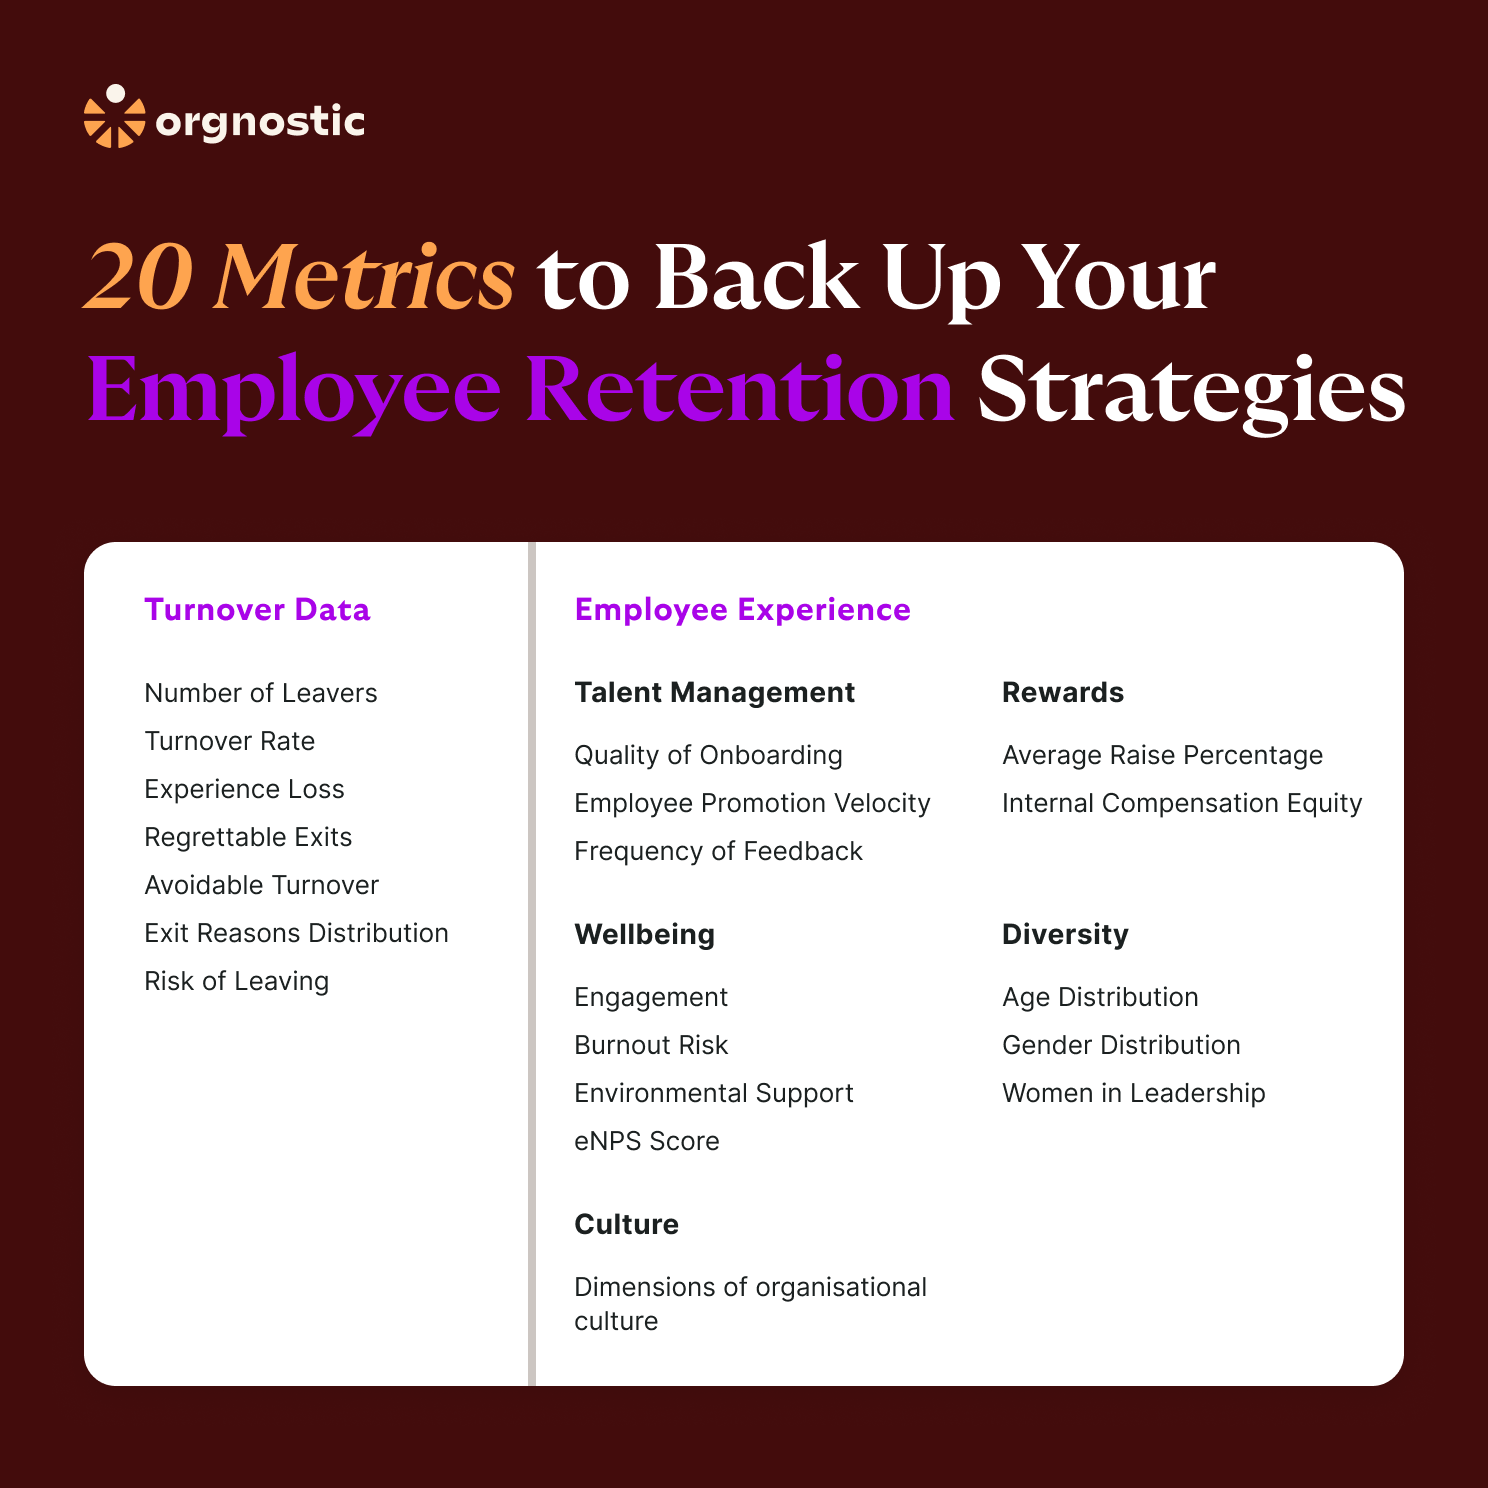
Below we propose 20 metrics that give clear insights about turnover and its causes, and inform your retention strategy.
Part 1: Turnover data
The data about how many people leave your organization is probably the first insight that you should look at.
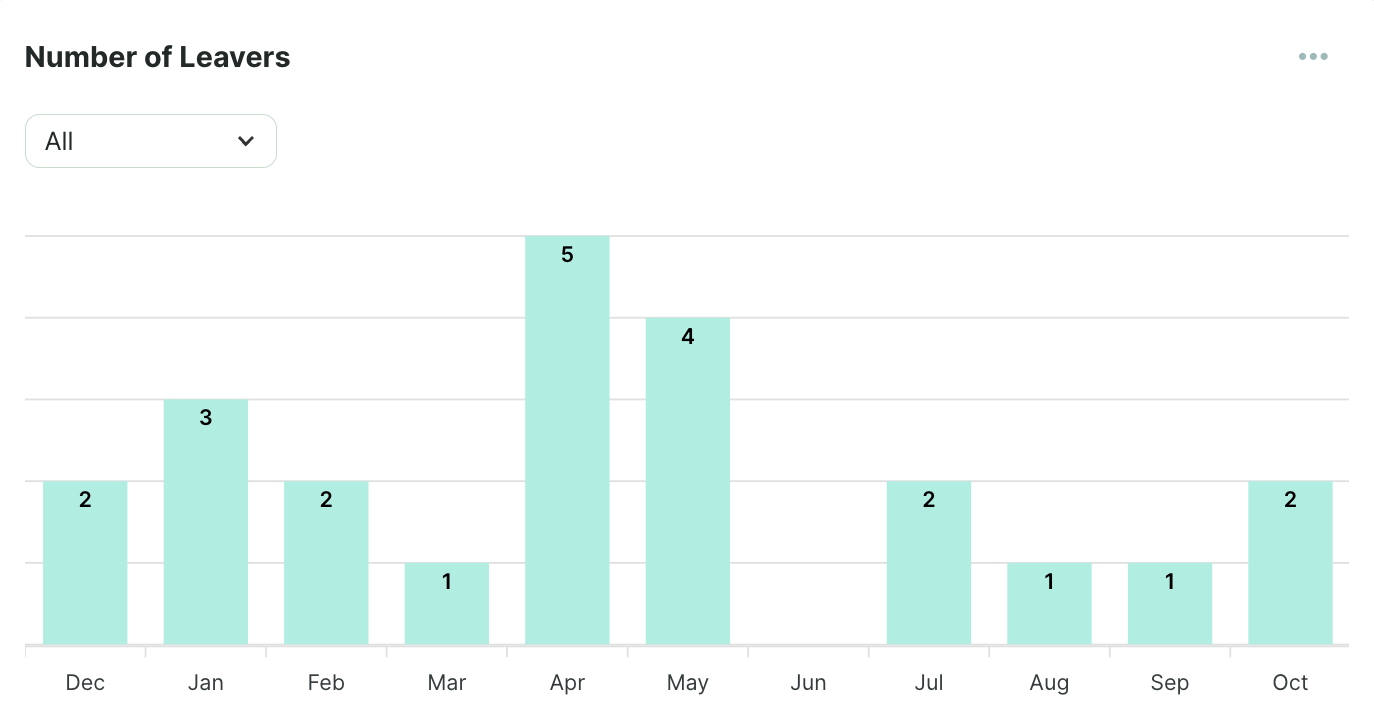
1. Number of leavers
Monitoring the number of leavers is an obvious choice.
However, this simple count of employees who left the company during a certain period is not enough to understand why people leave and then design a retention strategy.
It is hard to assess the turnover results by looking only at the number of leavers. To be useful, this information should be put in context, and translated into specific measures that provide more detailed and meaningful insights.
2. Turnover Rate
A good example of a more informative metric, essential for your retention strategy, is turnover rate. To calculate it, divide the number of employees that left the company by the total number of employees in a given period:
The turnover rate is expressed as a percentage, so it is more informative than the number of leavers.
Compared to an isolated number, a percentage gives a better understanding of how large the attrition is in the context of the organization, or its specific departments. It also allows for comparing your results to the industry average.
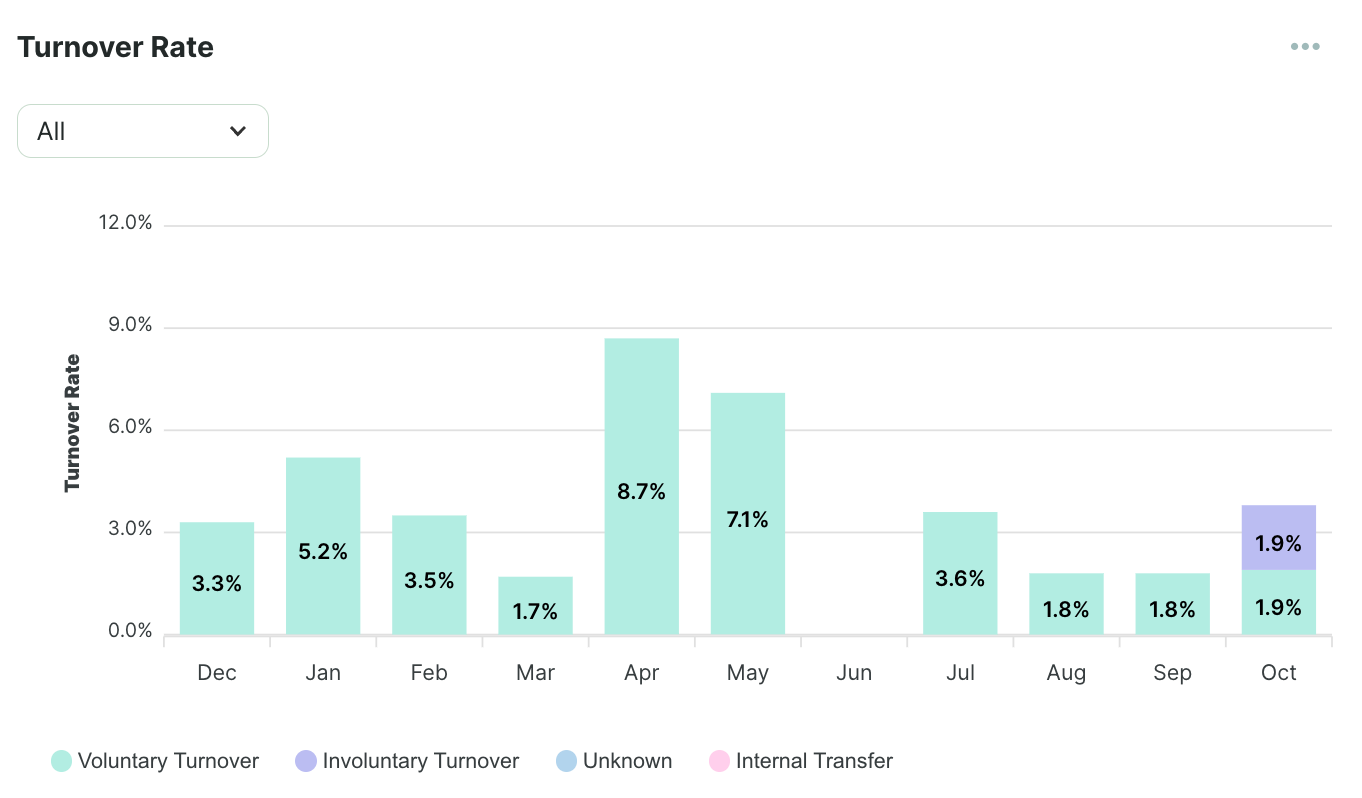
Once we have an overview of turnover, it’s helpful to look at the metrics that describe it in more detail. For example, following the basic formula for the turnover rate, you can calculate voluntary turnover and the percentage of employees who were let go.
You can also use complementary measures that will give you additional insights about turnover, such as experience loss, regrettable exits, avoidable turnover, and exit reasons distribution.
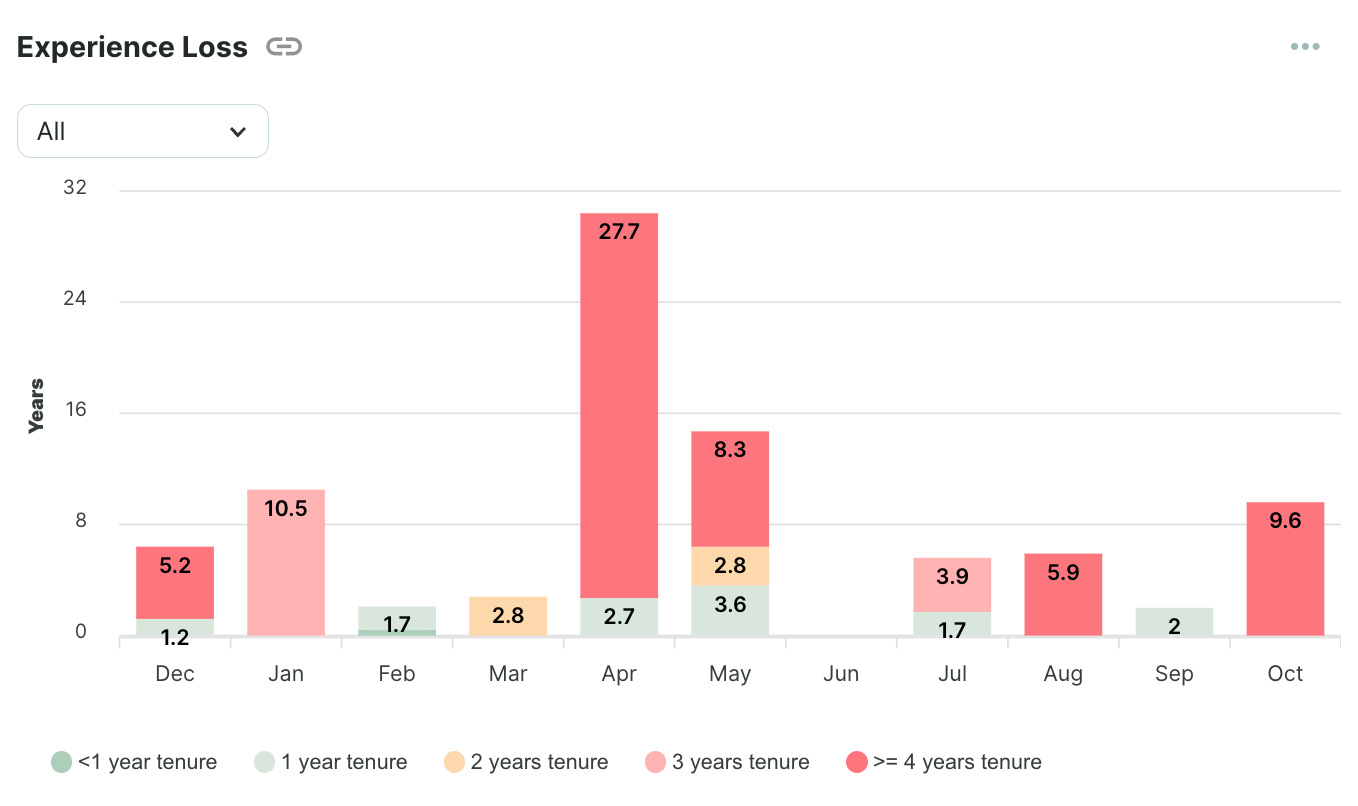
3. Experience Loss
The Experience Loss metric is the total amount of tenure lost as a result of voluntary turnover over a specific period. To calculate it, sum up the time (expressed in years) during which the employees hold their jobs in the organization before they decided to leave.
The costs of turnover tend to be higher for long-tenured employees, especially for those who over time built quality expertise, knowledge, and skills that are hard to replace.
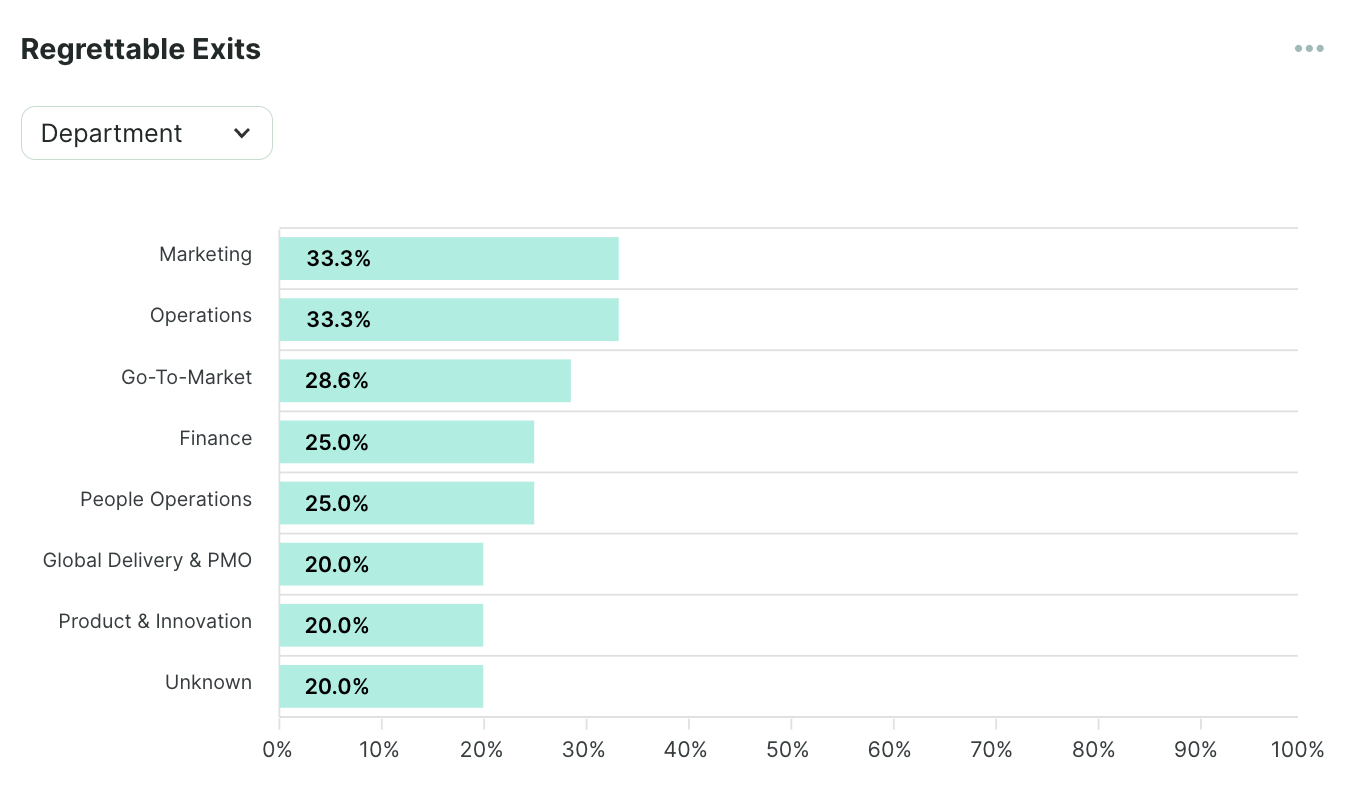
4. Regrettable Exits
We consider an employee’s exit regrettable when it negatively affects the team. To calculate it, you first should assess the impact of the employee’s departure on their team; for example, you can ask a direct manager whether the employee who left would be eligible to rehire. Then you calculate the following ratio:
The employees whose exit is regrettable usually play an important role in delivering business goals and providing a lot of value to the organization and the team. Monitoring the regrettable exits helps you check whether your retention strategy is successful in this group of employees.
5. Avoidable Turnover
Avoidable turnover refers to the percentage of employees who communicated their willingness to change a job before they left:
This metric shows whether you take timely action to address potential turnover, once the employee starts considering leaving.
6. Exit Reasons Distribution
Ideally, the turnover numbers are complemented with qualitative information from exit surveys. Qualitative insights help understand why people leave. For example, you can ask the leavers about what they expect to gain or lose with the change of employer.
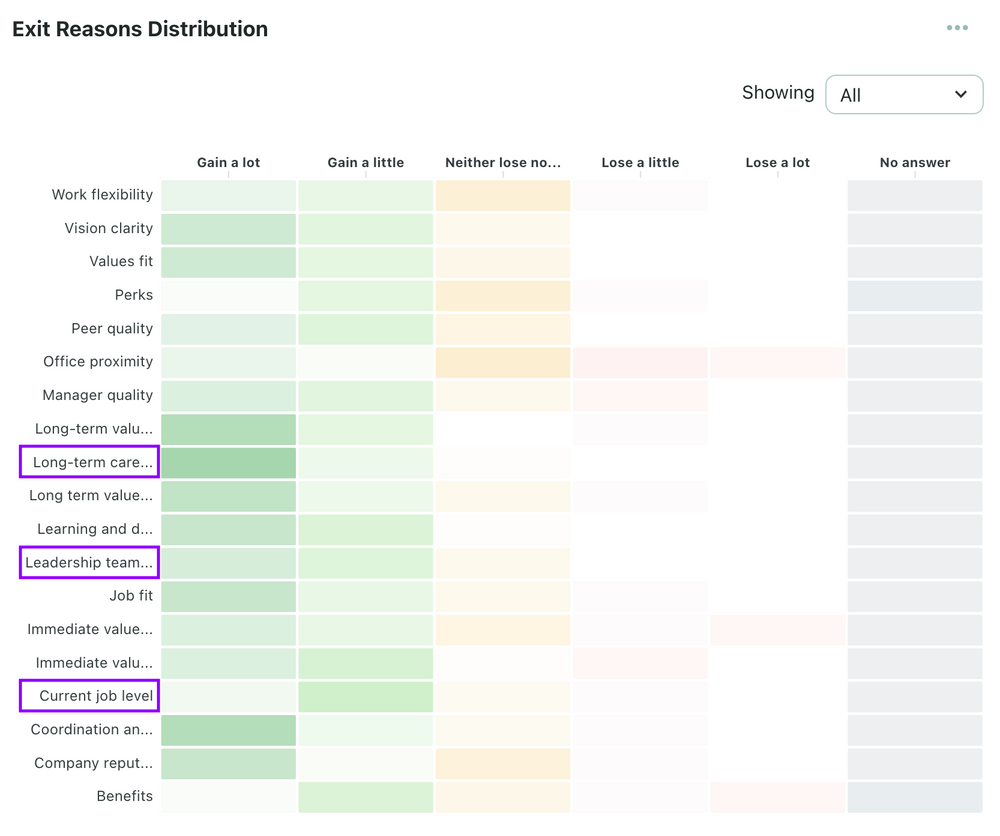
This map of exit reasons helps uncover the aspects that should be prioritized and improved by our retention strategy.
7. Risk of leaving
The metrics that we discussed so far focus on people who already left the company. But you can also analyze the risk of leaving for the current employees, calculating the expected probability that an employee will quit the job at a specific year of tenure.
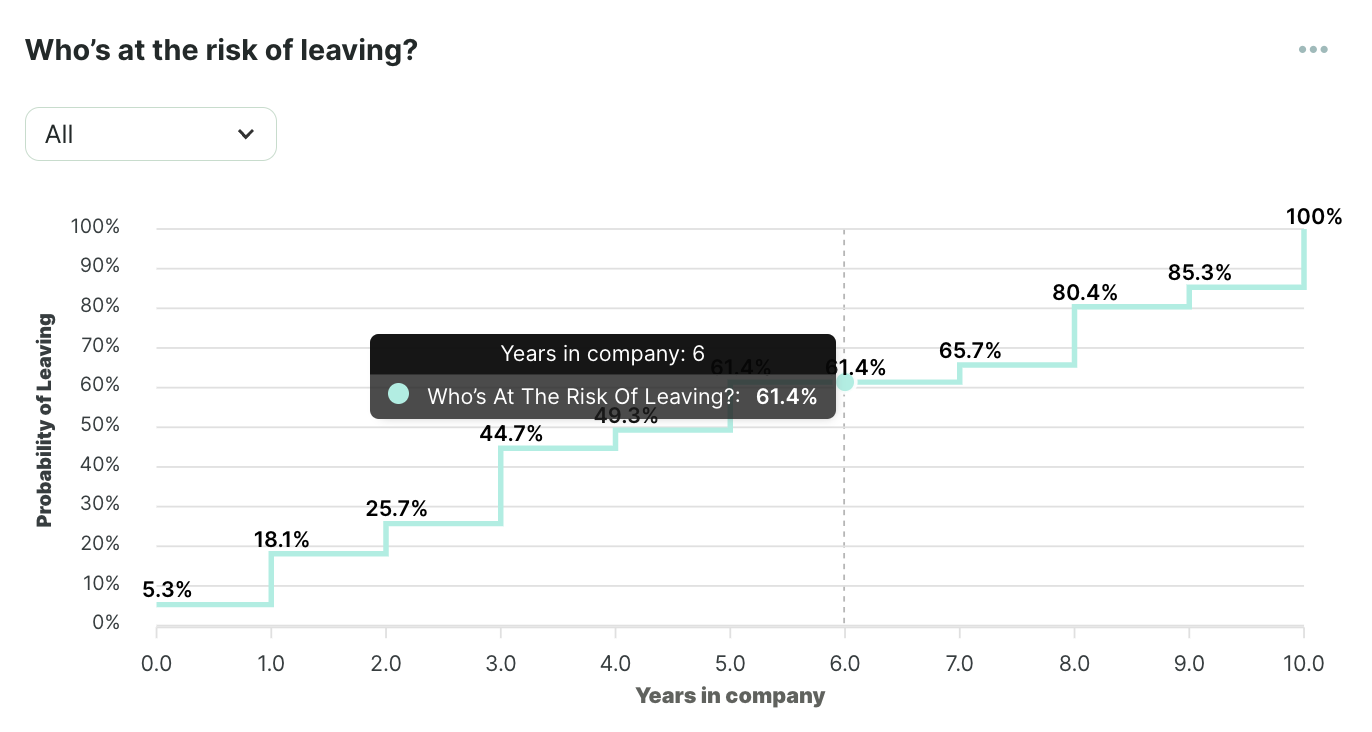
This information can be filtered by role, department, or location, so we can check if there are specific groups where the risk of leaving is particularly high.
Plus, you can add the information from the exit interviews to the equation and predict the probability of leaving with more details. For example, you can estimate the time after which employees would leave the company, considering different levels of satisfaction with development opportunities.
Examining the risk of leaving is extremely valuable to inform our retention strategy, as it focuses on what may happen in the future and help us keep our key employees from leaving.
Part 2: Employee experience data
Once you have an overview of the turnover data, you should analyze why your employees are leaving. To get a full understanding of employee experience, you need to combine both the quantitative metrics – and the feedback you get through employee surveys.
Below are examples of employee experience metrics that help understand which factors cause turnover.
For clarity, we organized them into five categories:
- talent management,
- rewards,
- employee well-being,
- diversity, and
- culture.
Category 1: Talent Management
8. Quality of Onboarding
Onboarding is a key process in the employee journey and has a direct impact on employee experience and results.
Assessing the quality of onboarding gives insights into the newcomers’ experience and progress during the first period in the organization.
The quality of onboarding can be measured with a survey that lists onboarding goals that the new hire should meet, and represented as a percentage with the following formula:
Successful onboarding increases the chances that the new hires will quickly adapt, be motivated and productive, and stay in the organization. For this reason, solid onboarding is an essential part of the retention strategy.
9. Employee Promotion Velocity
Employees’ professional growth is best illustrated by reaching a higher position in the company. A useful metric here is Employee Promotion Velocity. It shows how fast the employees climb the career ladder in the organization:
Lack of possibilities to progress is a frequent reason why people decide to leave. Having an overview of the employee promotion velocity lets us spot the employees who “got stuck” in their roles, explore growth opportunities for them, and take action.
10. Frequency of feedback
Another useful metric is the frequency of feedback. It is simply the average time between two feedback sessions that the employee had:
Feedback is a powerful tool to motivate people. Making sure that the employees receive timely feedback on their performance and have opportunities to share insights on their experience in the company helps keep them engaged and improves retention.
Category 2: Rewards
11. Average Raise Percentage
Providing growth opportunities is important for retaining talent, and it should go hand in hand with a salary raise. One metric to use here is the Average Raise Percentage. It shows the average percentage of salary increases within a specific time frame. To estimate it, calculate how much the salary has changed on the individual level:
Once you have the percentages of individual salary increase, you can calculate the average raise percentage for a specific role or department, and for the entire organization.
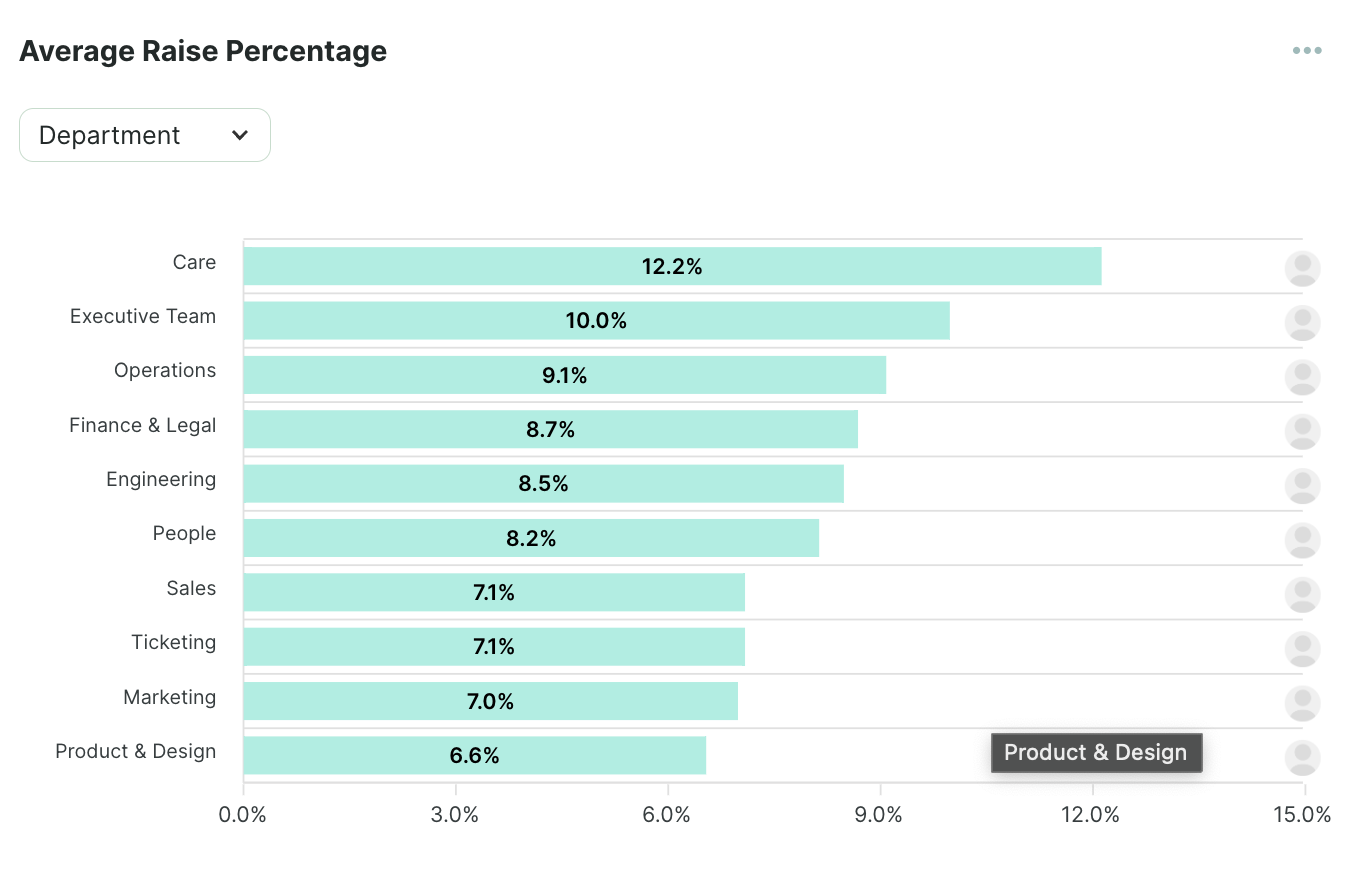
Average salary raise is useful for internal and external benchmarking, as well as for identifying outliers. Employees disappointed with their salary will search for better job opportunities, so your retention strategy shouldn’t miss insights about compensation.
12. Internal Compensation Equity
Besides the salary raise, you can check how the employees compare to their colleagues. To analyze it, use the Internal Compensation Equity metric that shows the spread of pay per job role and seniority levels. In the visual below, you can see a distribution of individual payrolls (with their minimum, maximum, and median values) for male and female employees:
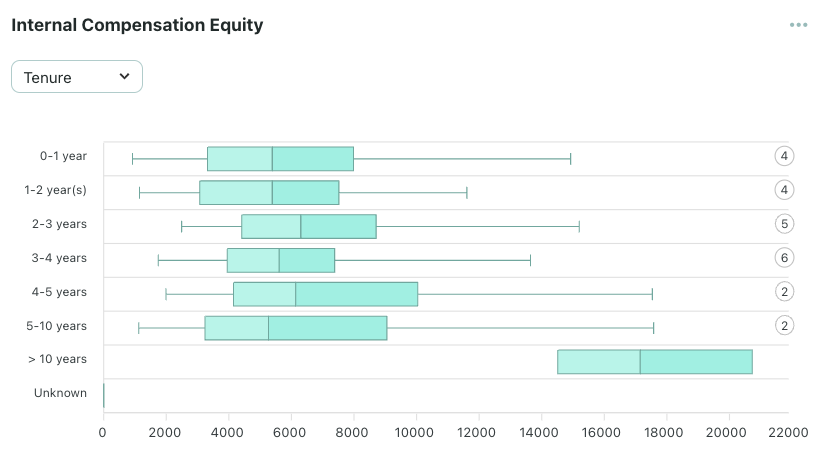
A fair compensation strategy is another factor that keeps our workforce motivated; in turn, motivated employees are likely to stay in the company for longer.
Category 3: Employee wellbeing
13. Employee Engagement
Employee engagement is an output metric of employees’ energy, commitment to work, and absorption in their everyday job. You can measure the levels of these three dimensions of employee engagement with automated surveys.
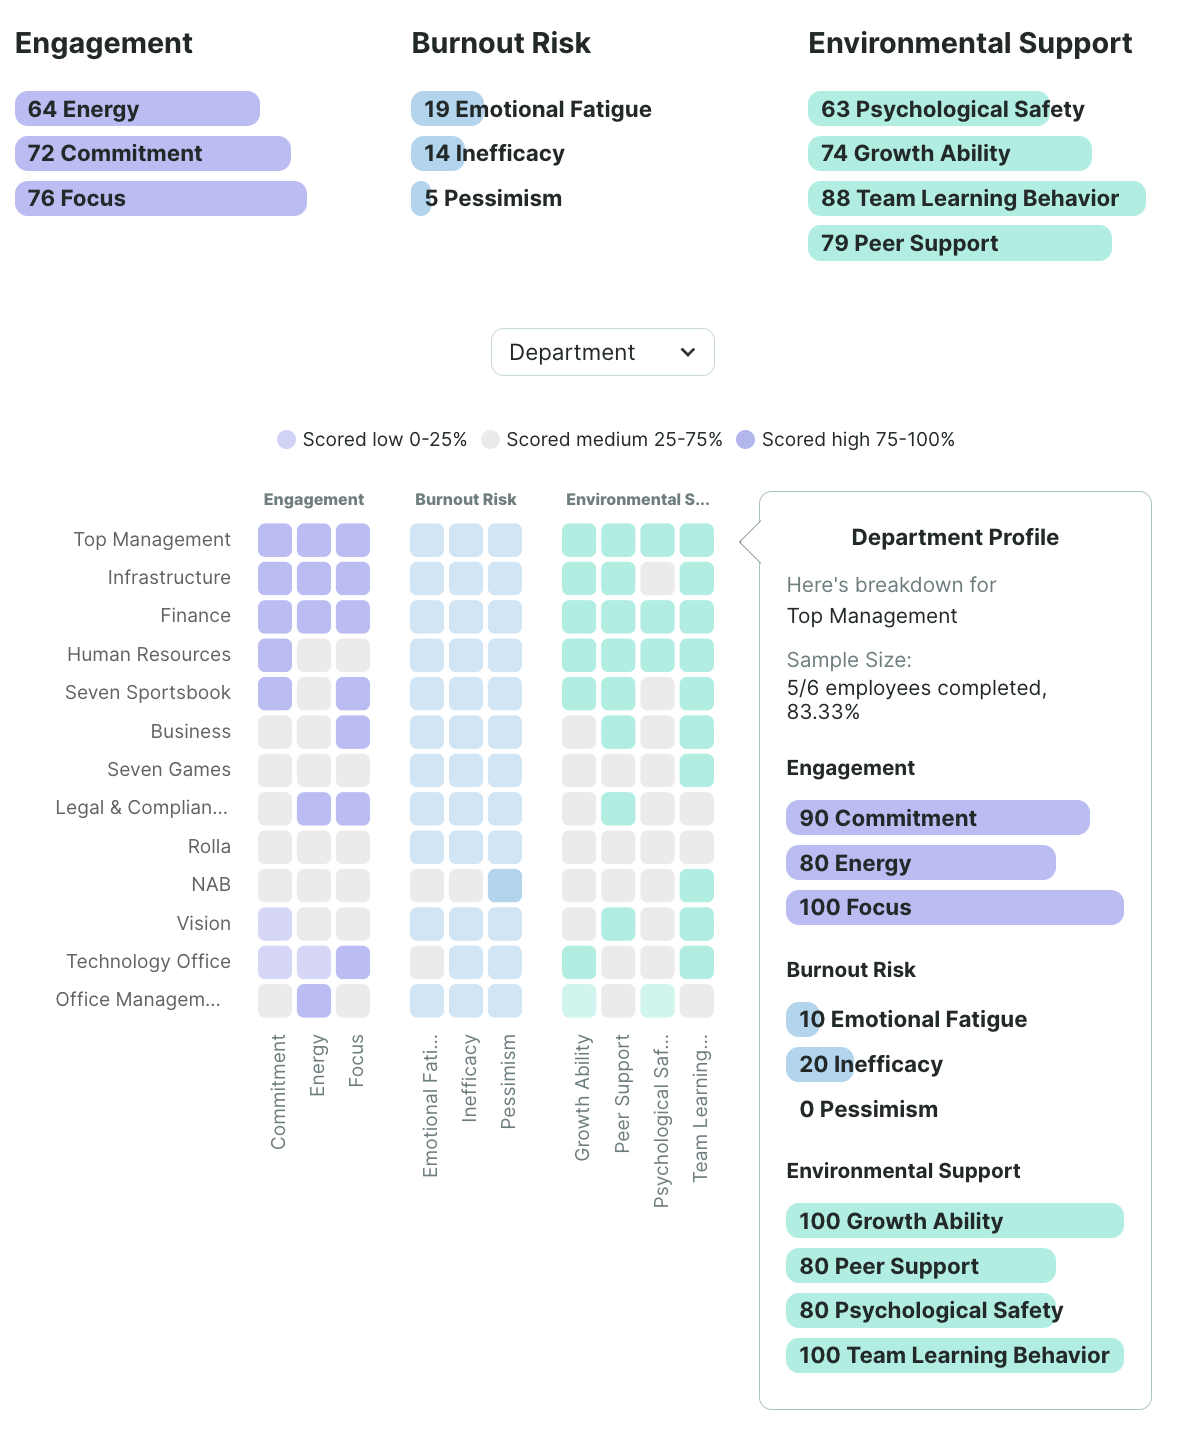
The level of employees’ engagement shows their emotional involvement. A drop in engagement suggests that the employees’ experience is worsening, which may result in leaving the company.
14. Burnout Risk
You should also keep an eye on possible employee ill-being, including burnout. The Orgnostic platform allows you to run automated surveys to measure the three dimensions of burnout: employees’ exhaustion, cynicism, and self-esteem.
Information about these three dimensions would help you identify the risk of burnout early on, and prevent its negative consequences of burnout, including turnover.
15. Environmental Support
Environmental support refers to workplace-related factors that contribute to the overall mental well-being of your employees.
You can measure four dimensions of Environmental Support:
- psychological safety,
- professional growth ability,
- peer support, and
- team learning behavior.
Controlling these four factors contribute to a positive employee experience and helps reducing turnover.
16. Employee Net Promoter Score
Finally, you can look at the Employee Net Promoter Score (eNPS). This metric represents the number of employees who would recommend your company as a great place to work.
You can calculate it by subtracting the percentage of detractors (employees who are unlikely to recommend the company) from the percentage of promoters (employees who would strongly recommend the company):
The score ranges from -100 to 100.
eNPS is a powerful indicator of overall employee experience. Moreover, you can complement the numbers with qualitative comments that would give you detailed insights into the factors that contribute to employee satisfaction.
Category 4: Diversity
17. Age Distribution
Age Distribution shows what is a representation of different employee age groups in your organization and in specific areas and roles. For example, you can check age distribution across different departments:
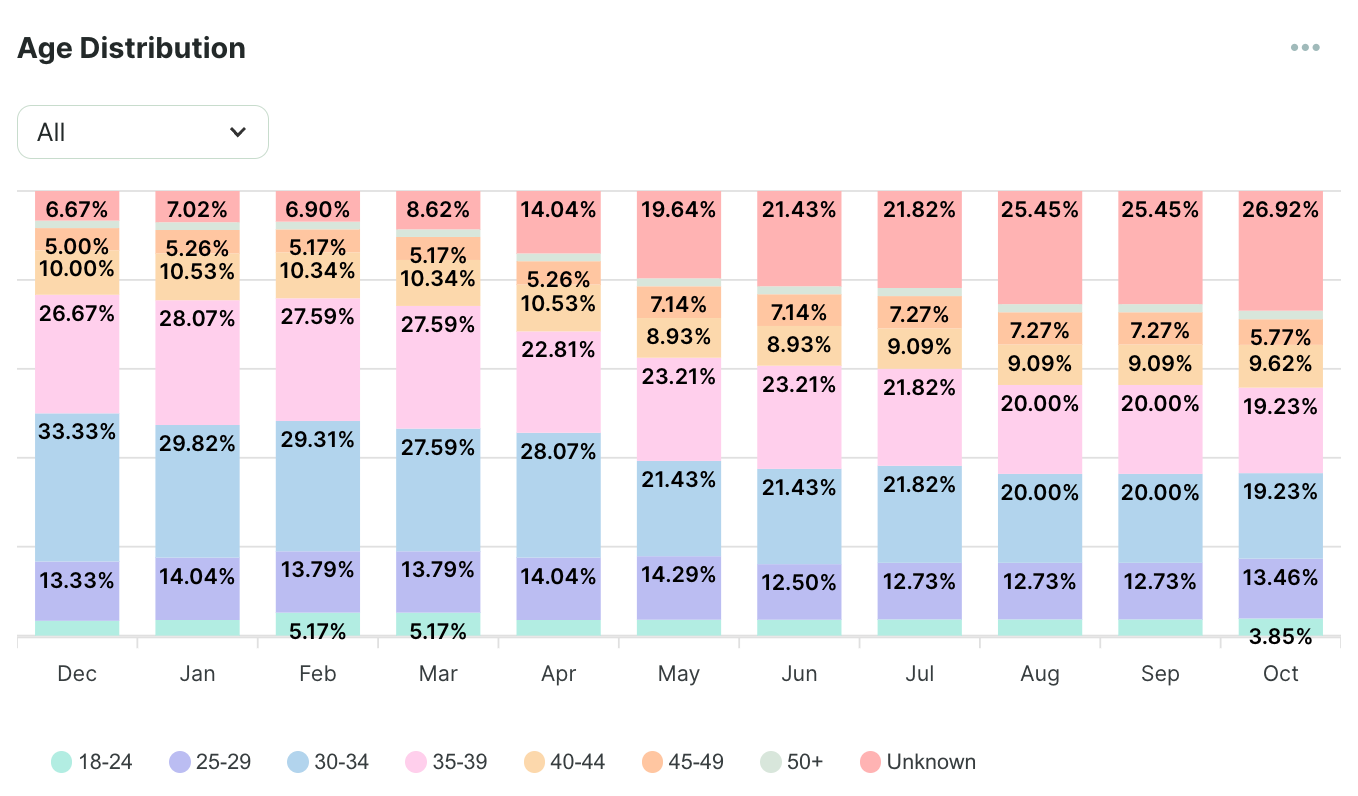
Age distribution helps oversee the groups of employees that are reaching retirement age, and to plan for replacement once they leave. This is essential for the profiles that are strategic and difficult to replace.
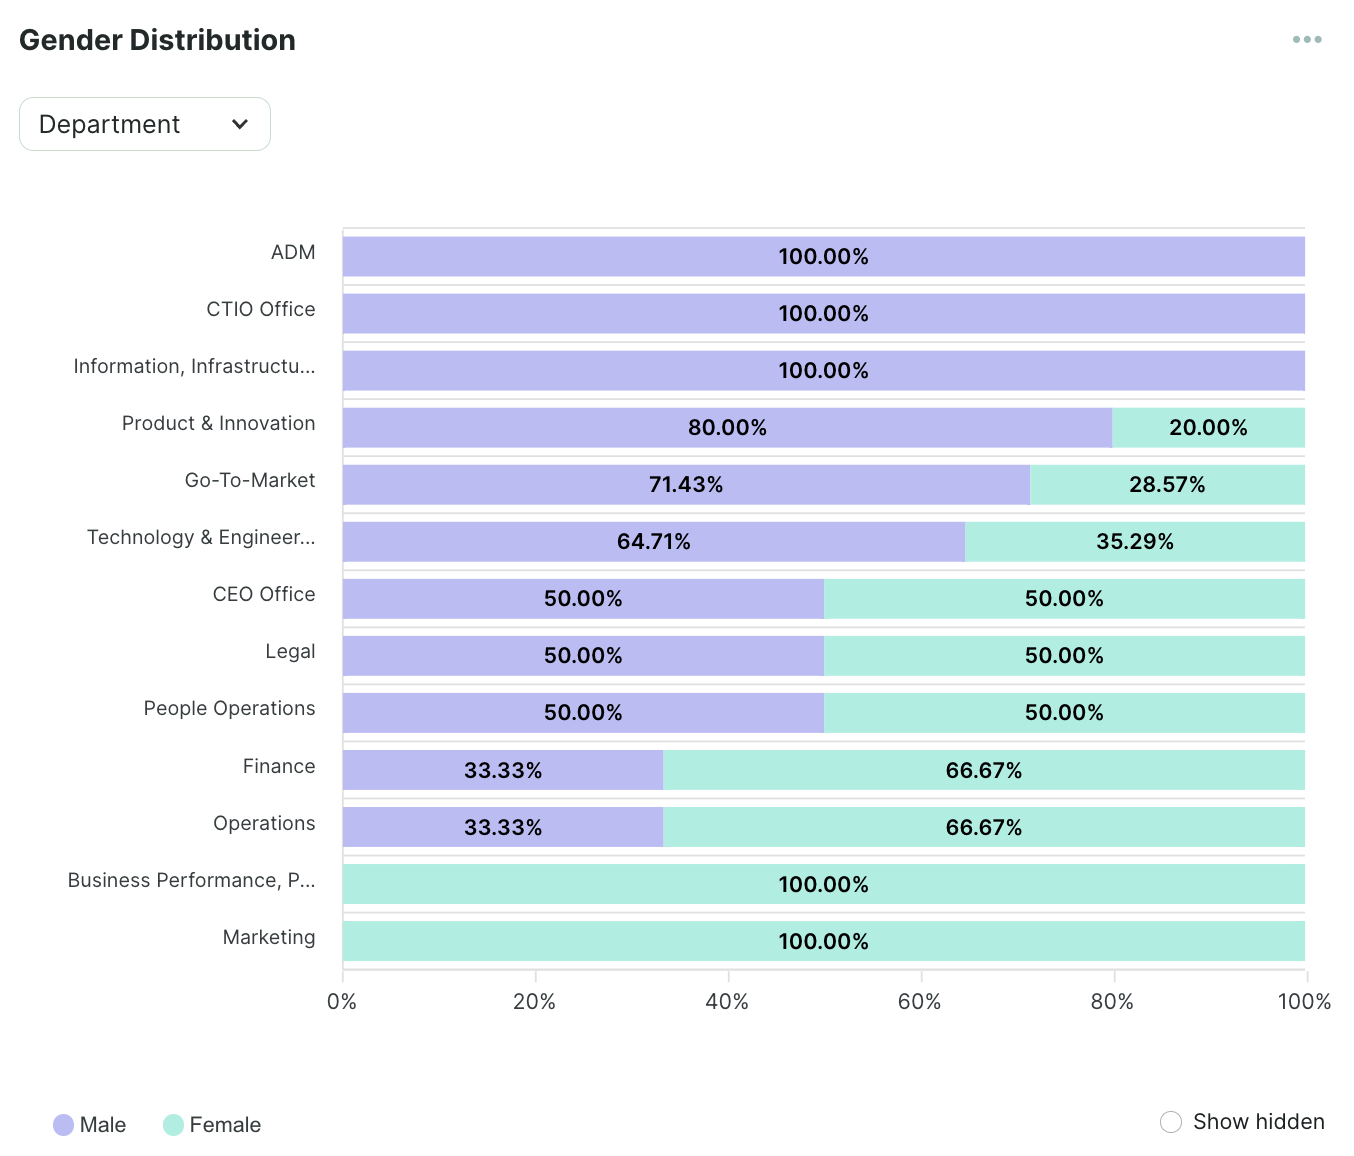
18. Gender Distribution
Another diversity metric is gender distribution. It shows how the composition of male and female employees is changing as the company grows and develops. To calculate it, you can use this simple formula:
You can also be more specific and explore gender distribution for specific roles and departments.
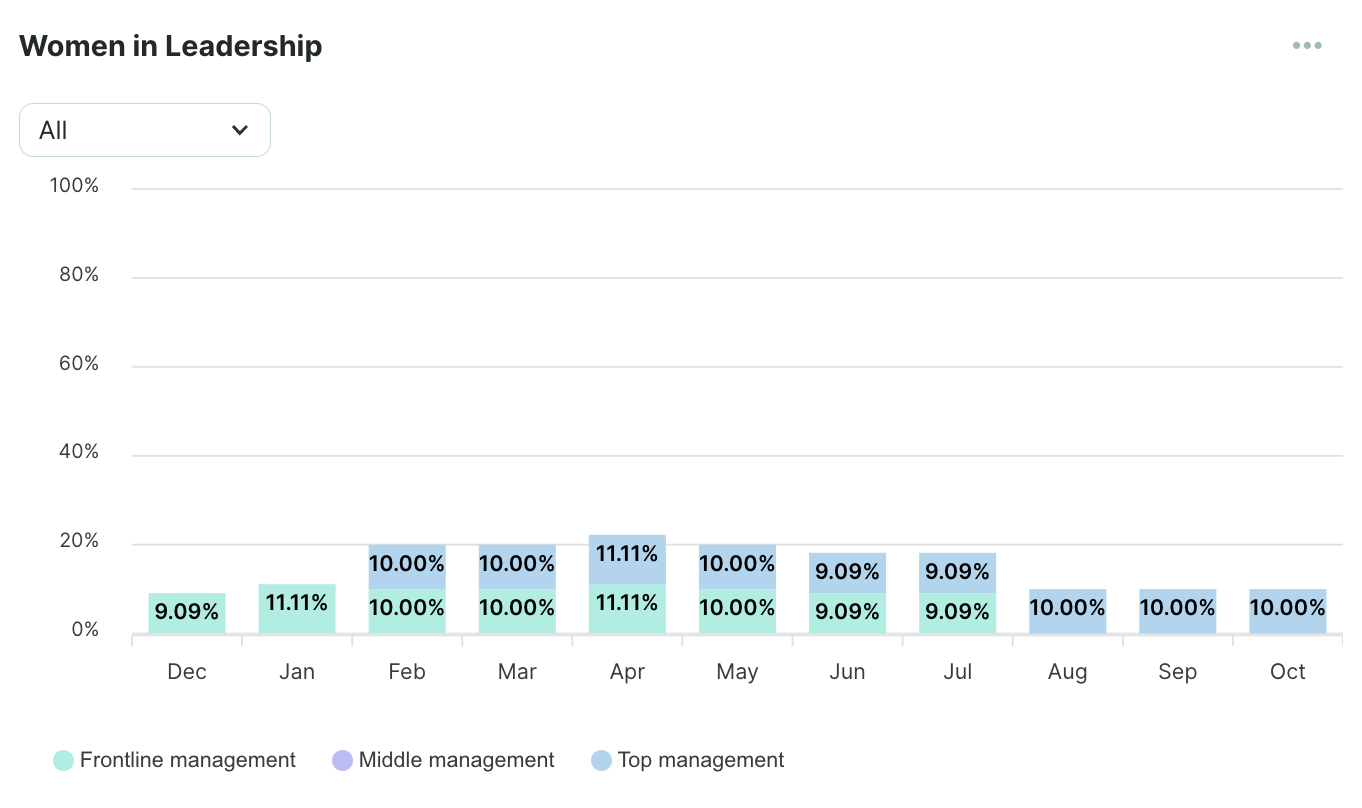
19. Women in Leadership
Women in Leadership is an example of a metric that shows the gender distribution in a specific role. It informs about the representation of women in managerial positions. To calculate it, adapt the basic Gender Distribution formula:
You can adjust the formula, applying it to other minority groups, areas, roles, and departments that you are interested in.
The diversity distribution metrics give you a perspective on how diverse groups of employees are spread across the roles. They help spot the groups that are underrepresented in certain positions and ensure that your retention strategy doesn’t miss any group.
Category 5: Organizational Culture
20. Dimensions of organizational culture
The concept of organizational culture is complex and challenging to measure.
What helps is if you break it down into four specific, culture-related dimensions:
- mission (for example, shared and clear goals and objectives that are ambitious but realistic),
- consistency (for example, a strong alignment of goals and values across the organization),
- involvement (for example, employees are involved in the organizational processes and empowered to make decisions), and
- adaptability (for example, flexibility and openness to new ideas).
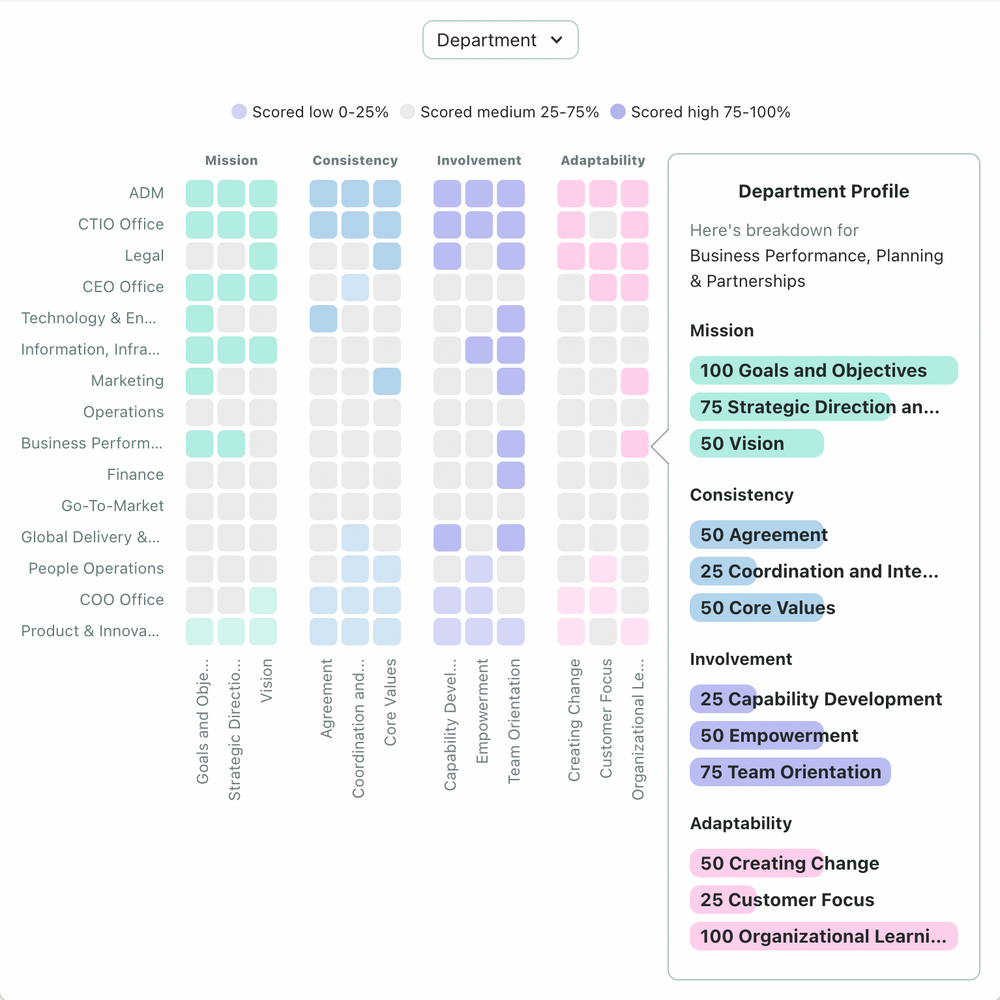
These dimensions play an important role in the overall employee experience and feed your retention strategy.
How to create an employee retention strategy with your people analytics tool
Data and analytics help you diagnose the areas where you can improve employee experience and in turn reduce turnover.
However, this data needs to be contextualized.
Relying solely on quantitative data, without understanding the qualitative aspect, leaves room to create retention strategies that don’t factor in employees’ experience.
With a People Analytics platform like Orgnostic, you can combine the power of people analytics and employee listening, and create a comprehensive strategy that will help you retain top talent onboard.